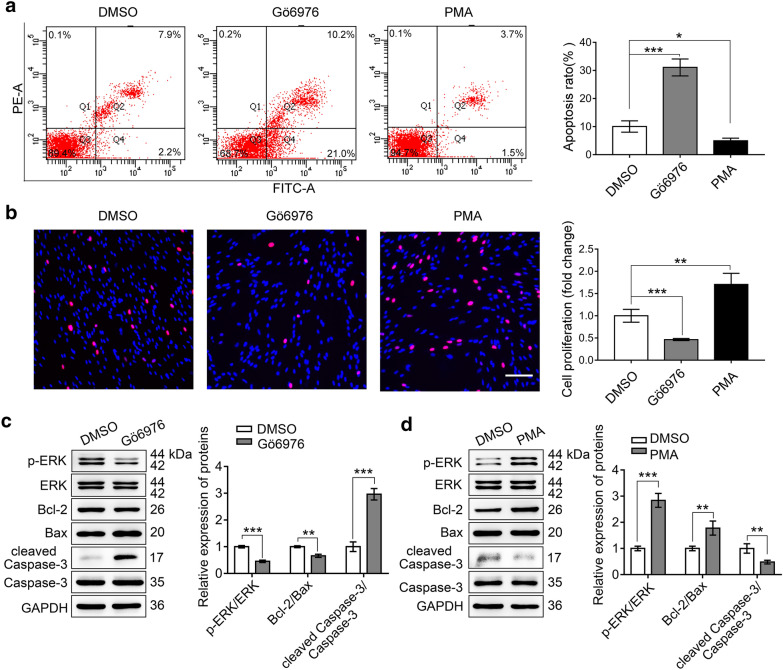
Fig. 2.
PKCα promoted the proliferation and inhibited apoptosis of SCs. a Flow cytometry analyzed the apoptosis of SCs treated by Gö6976 (PKCα inhibitor), PMA (PKCα activator) and DMSO. Representative images (left) and quantification ratio (right) were shown. b EdU analysis of the proliferation of SCs treated by Gö6976, PMA, and DMSO. Representative images (left) and quantification data (right) were presented. Scale bar, 100 μm. c, d Western blot analysis of p-ERK, ERK, Bcl-2, Bax, cleaved Caspase-3, and Caspase-3 after Gö6976 or PMA treatment in SCs. Representative blot (left) and quantification of relative expression (right) were shown, respectively. Data are shown as mean ± SEM from triplicate experiments. *P < 0.05, **P < 0.01, ***P < 0.001

