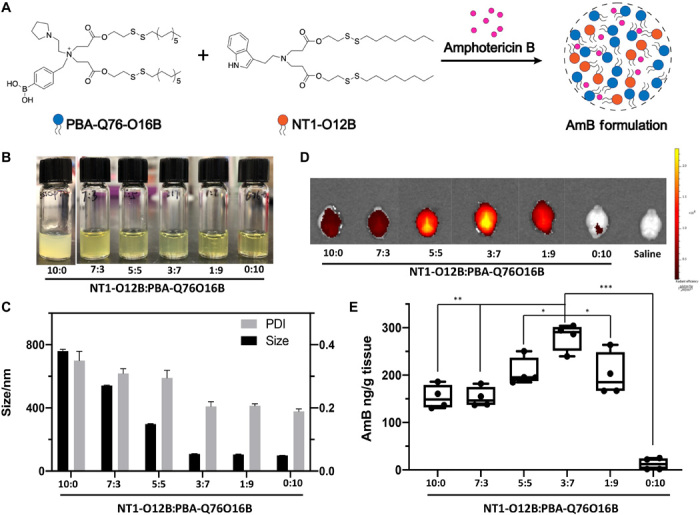
Fig. 2. NT-LNPs delivering AmB into the mouse brain.

(A) Chemical structure of PBA-Q76-O16B, NT1-O12B, and schematic illustration of the doped NT1-lipidoid AmB formulation. (B) Photographs of AmB formulations in NT1-O12B doped with different amounts of PBA-Q76O16B (weight ratio is used). The pure NT1-O12B/AmB encapsulates appeared as an opaque suspension, while the appearance of the encapsulates changed from translucent solutions to homogeneous transparent yellow solutions as the doping ratio of PBA-Q76-O16B lipidoid increased. Photo credit: Feihe Ma, Tufts University. (C) Hydrodynamic diameters and PDIs of different NT-LNP/AmB formulations determined by DLS measurements. (D) Representative fluorescence images of the dissected mouse brain 1 hour after one-time intravenous injection of DiR-loaded NT1-O12B/PBA-Q76-O16B LNPs (1 mg/kg). The weight ratio of DiR in LNPs is 10%. (E) AmB concentration in brain tissues 24 hours after intravenous injection of AmB (5 mg/kg) in various NT1-O12B/PBA-Q76-O16B LNP formulations measured using HPLC (n = 4 per group). The mice were perfused with saline before dissected. One-way analysis of variance (ANOVA), Sidak post hoc analysis, *P < 0.05, **P < 0.001, or ***P < 0.0001. Graphical data are represented as box and whisker plots with individual points overlaid, where error bars represent maximum and minimum values and the boxed line represents the median.
