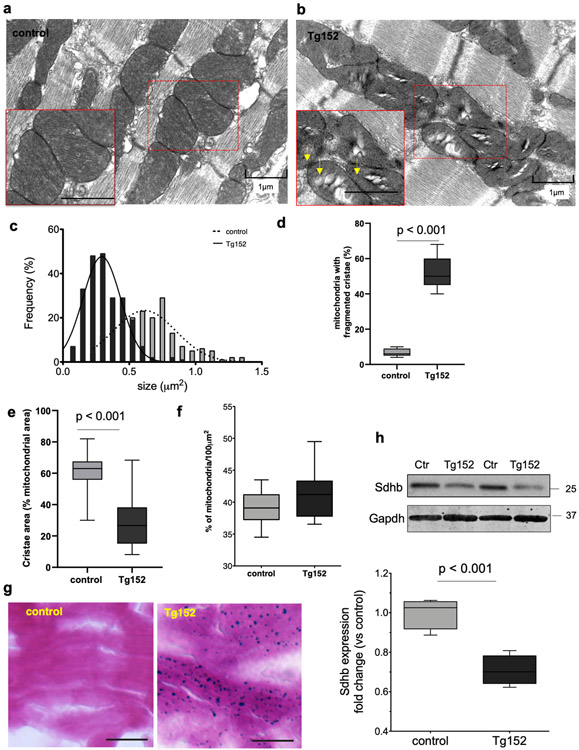
Figure 5. Mitochondria abnormalities in Tg152 hearts.
a-b) Representative electron microscopy images of longitudinal LV tissue sections showing the myofilament and mitochondria ultrastructures in control and Tg152 cardiomyocytes. Arrows indicate electron dense particles in mitochondria. (n=3 animals per group). c) Morphometric analysis of mitochondrial size from the electron microscopy images (n=225 mitochondria, 3 hearts per group). d-e) Morphometric analysis of mitochondrial cristae quality and density in Tg152 and control cardiomyocytes. f) Quantification of mitochondria content in control and Tg152 cardiomyocytes expressed as percentage (%) of mitochondria occupied surface area per 100μm2. Comparison by unpaired student’s t-test; n=3 animals per group. g) Histological assessment of iron accumulation in heart LV cryosections in control and Tg152 by Prussian blue staining. Scale bar = 25 μm (n=3 animals in each group). h) Representative Western blot analysis of Sdhb and densitometry analysis of the protein expression levels. Comparison by unpaired Student’s t-test; n=4 animals per group. Gapdh was used as a loading control. Number indicate the molecular weight marker size (kDa). Box-and-whisker plots show the minimum, the 25th percentile, the median, the 75th percentile, and the maximum.

