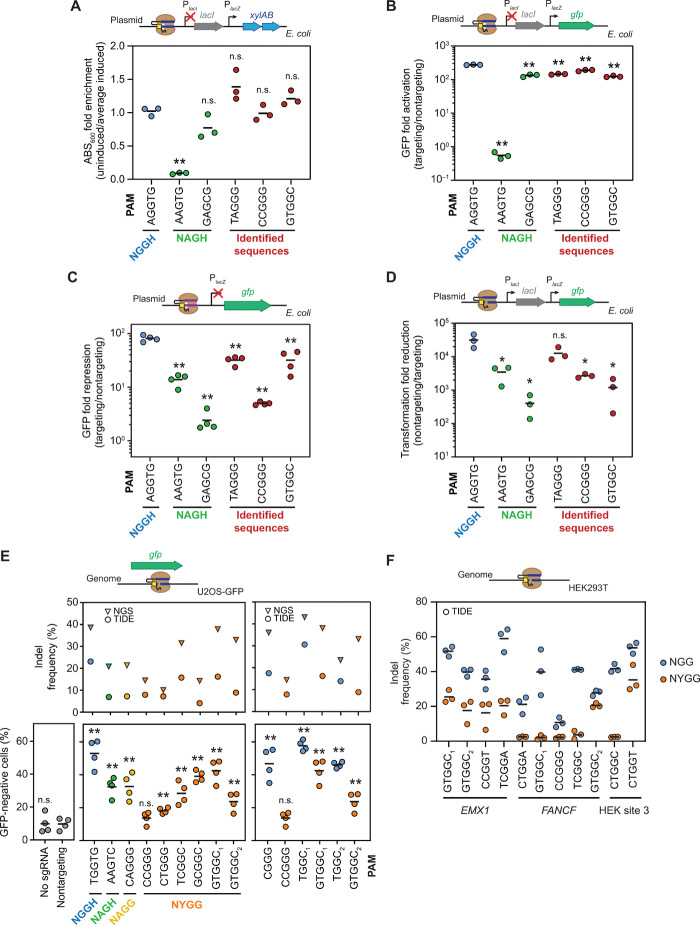
Fig. 2. Validation of individual PAM sequences in E. coli and U2OS cells.
Assessing individual PAM sequences in E. coli (A) using the growth-based genetic circuit and measuring turbidity of the culture, (B) using the growth-based circuit with gfp replacing xylAB and measuring GFP fluorescence, (C) through direct transcriptional repression of gfp under the control of the lacZ promoter by measuring GFP fluorescence, and (D) through plasmid clearance by targeting the same construct from (B) with catalytically active SpyCas9. A nontargeting Sth1 sgRNA served as the nontargeting control. Assessing individual PAM sequences by targeting (E) gfp in U2OS-GFP cells and (F) genomic sites in HEK293T cells. Indels were measured with TIDE (17), CRISPResso analysis (18), and flow cytometry analysis. The NYGG data are the same in both (E) panels. Indel formation calculated by TIDE is in reference to a nontargeting control sample. Values are based on independent experiments starting from separate E. coli colonies or separate cell culture wells. Bars represent the mean of each set of triplicate or quadruplicate measurements. Statistical significance was calculated in comparison to the AGGTG sequence for (A) to (D) or the nontargeting sgRNA control in (E) using a two-tailed t test assuming equal variance with cutoffs of 0.05 (*) or 0.01 (**).

