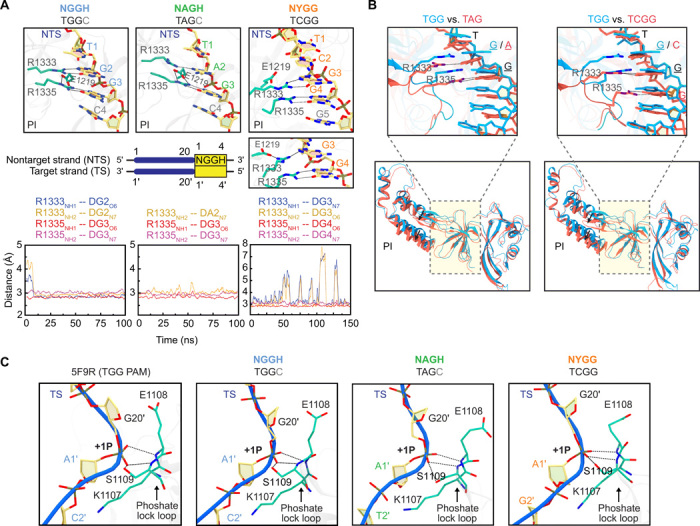
Fig. 4. Induced-fit recognition of an NYGG PAM by Cas9 revealed by MD simulations.

(A) Zoomed-in view of the TGG, TAG, and TCGG PAMs recognized by the Cas9 PI domain. The protein residues and nontarget DNA strand nucleotides are represented as a stick model and colored by cyan and yellow, respectively. The dashed lines denote hydrogen bonds and salt bridges. Two panels are shown for NYGG, where the simulations predicted R1333 switches between fully engaging the first G in the PAM and partially engaging this same nucleotide and E1219. Below each panel is the temporal evolution of the hydrogen-bonding distances between the bi-arginine and the PAM calculated from one representative simulation trajectory. (B) Structural superposition of the conformations for TAG and TCGG (cyan) onto TGG (red). The cleft of the PI domain accommodating the PAM and its flanking sequences is highlighted by a dashed rectangle and magnified in the above panel with the PAM. For clarity, dashed lines are only used to denote hydrogen bonds associated with recognition of NAG and NYGG. (C) Location of phosphate lock loop maintained across simulations. The corresponding interactions in the crystal structure (PDB code: 5F9R) used for the simulations are shown for comparison.
