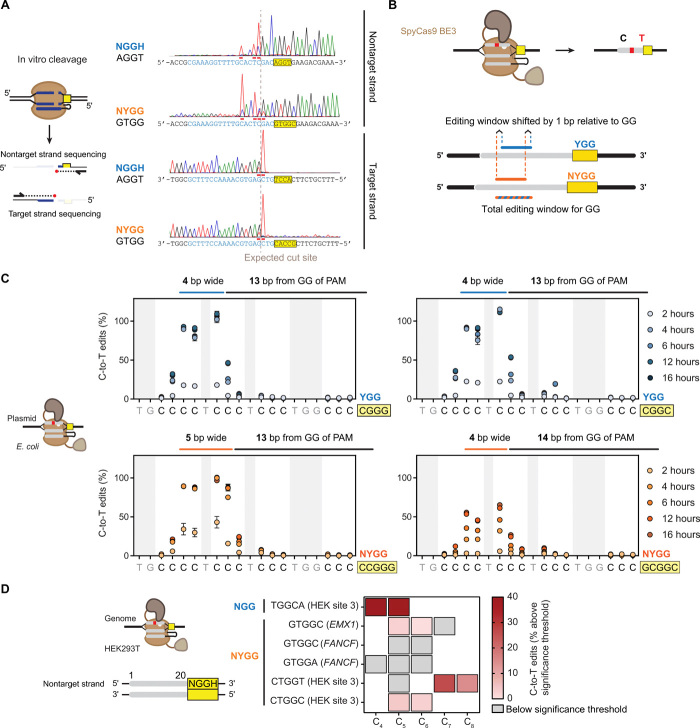
Fig. 6. Assessing the cleavage site and base editing location for NYGG-flanked targets.
(A) Mapping the in vitro DNA cleavage site. Digested fragments were subjected to run-off Sanger sequencing. Chromatographs were inverted to match the indicated strand’s sequence. Horizontal bars indicate A-tailing from sequencing. (B) Expected impact of using NGG versus the adjacent NYGG on base editing. (C) Determining the base editing location in E. coli. BE3 (31) was coexpressed with an sgRNA targeting the poly-C sequence flanked by different PAMs on a multicopy plasmid. C-to-T conversion was quantified with the Sequalizer algorithm (34) in comparison to a nontargeting control. Error bars represent the SD from three independent experiments starting from separate E. coli colonies. (D) Evaluating base editing efficiency when targeting the genome of HEK293T cells. C-to-T conversion was quantified with EditR on each of the three biological replicates. See Materials and Methods for how C-to-T edits (%) were calculated. Boxes outlined in black represent (C), while white spaces represent A/G/T in the target sequence. Gray boxes indicate values below the statistically significant editing threshold. Raw editing values and the EditR output can be found in fig. S7B.

