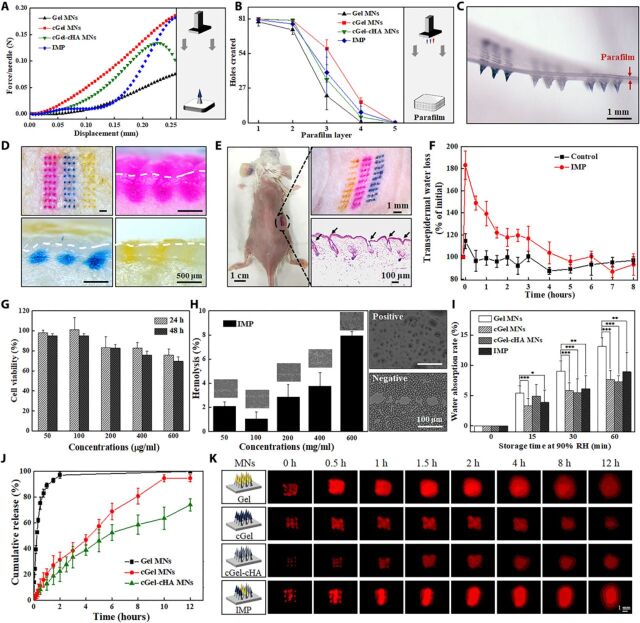
Fig. 4. Characterization of the fabricated MN patch.
(A) Typical force-displacement curve of the compression force of different material-based MNs. (Inset) Schematic illustration of the used setup. (B) Holes created in each parafilm layer after insertion of the MN patch using constant 5 N of compression force (n = 5). (C) Corresponding photograph of the first parafilm layer after removal of the supporting array. (D) Porcine cadaver skin after treatment with IMP (top left) and its corresponding histological sections penetrated by Gel MNs (top right), by cGel MNs (bottom left), and by cGel-cHA MNs (bottom right). The white dashed lines indicate the skin surface. (E) Mouse dorsum after treatment with an IMP and its corresponding histological section (bottom right). (F) TWEL values of mice skin at different time points after an IMP application (n = 5). (G) Relative viability of L-929 cells incubated with various concentrations of the IMP after 24 and 48 hours, respectively (n = 3). (H) Hemolysis assay results for the IMP. (Inset) Corresponding microscopic images of red blood cells with and without exposure (n = 3). (I) Hygroscopic analysis of the fabricated MNs at 90% RH atmosphere with different storage time. Asterisk indicates a significant difference (Student’s t test, *P < 0.05, **P < 0.01, and ***P < 0.001) (n = 8). (J) In vitro release profiles of insulin from the fabricated MNs in phosphate buffer (37°C) (n = 4). (K) Schematic illustration of the fabricated MNs, and real-time release of sulforhodamine B (red color) onto the porcine cadaver skin surface (0 to 12 hours). Photo credit for (C) to (E): Bozhi Chen, Beijing University of Chemical Technology.

