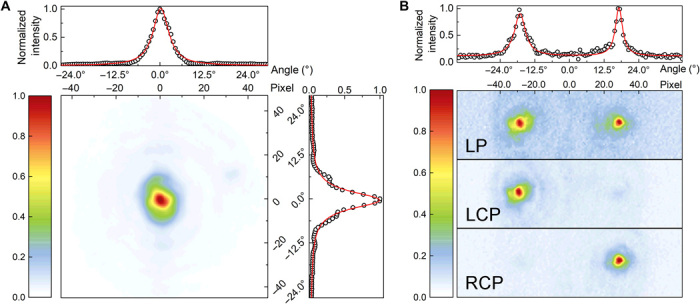
Fig. 4. Measured far-field patterns of devices 1 and 2.

(A) Measured Fourier image of the total far-field QD emission for device 1. (B) Measured Fourier image of the linear polarization (LP) and LCP and RCP far-field intensities of QD emission for device 2. The red solid lines are the Lorentz fitting of the line plot across the scattering peaks along the horizontal and vertical directions.
