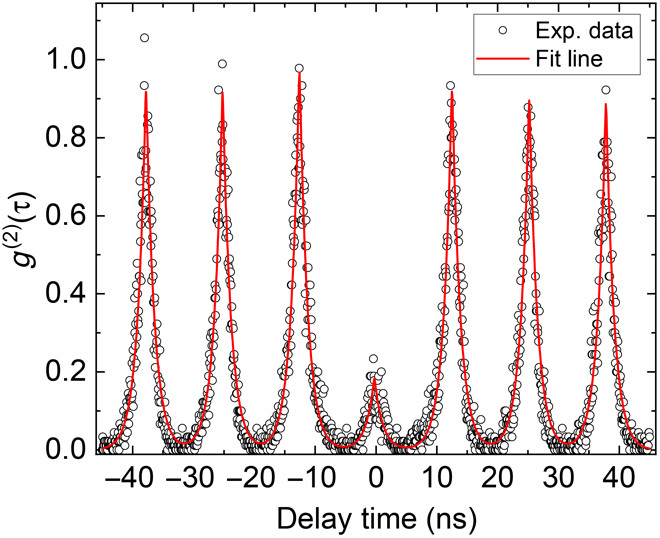
Fig. 5. Measured second-order correlation function g(2)(τ) of the QD emission after the fabrication of GaAs nanopillar and SSBM.

The black open circles show the measured results. The red line is the fitting curve using the model in (40). This value of g(2)(0) is calculated from the integrated area in the zero-delay peak divided by the average area of other peaks away from zero delay. The uncertainty value is given by propagation of the SD in the peak fitting.
