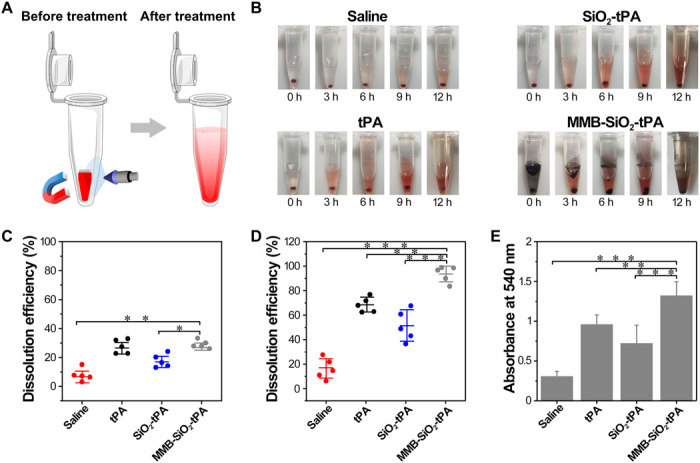
Fig. 5. Assessment of dissolution efficiency in ex vivo blood clots.

(A) Schematic illustration of the blood clot dissolution treatment process under the magnetic field combined with low-intensity ultrasound. (B) Representative images of the thrombolysis processes at 0, 3, 6, 9, and 12 hours after being treated by saline, native tPA, SiO2-tPA, and MMB-SiO2-tPA, respectively. (C) Quantification of the dissolution efficiency by measuring the mass loss of the blood clot at 3 hours after treatments. (D) Quantification of the dissolution efficiency by measuring the mass loss of the blood clot at 12 hours after treatments. (E) Absorbance values (λ = 540 nm) of the supernatants at 12 hours after treatments; n = 5; *P < 0.05, **P < 0.01, and ***P < 0.001.
