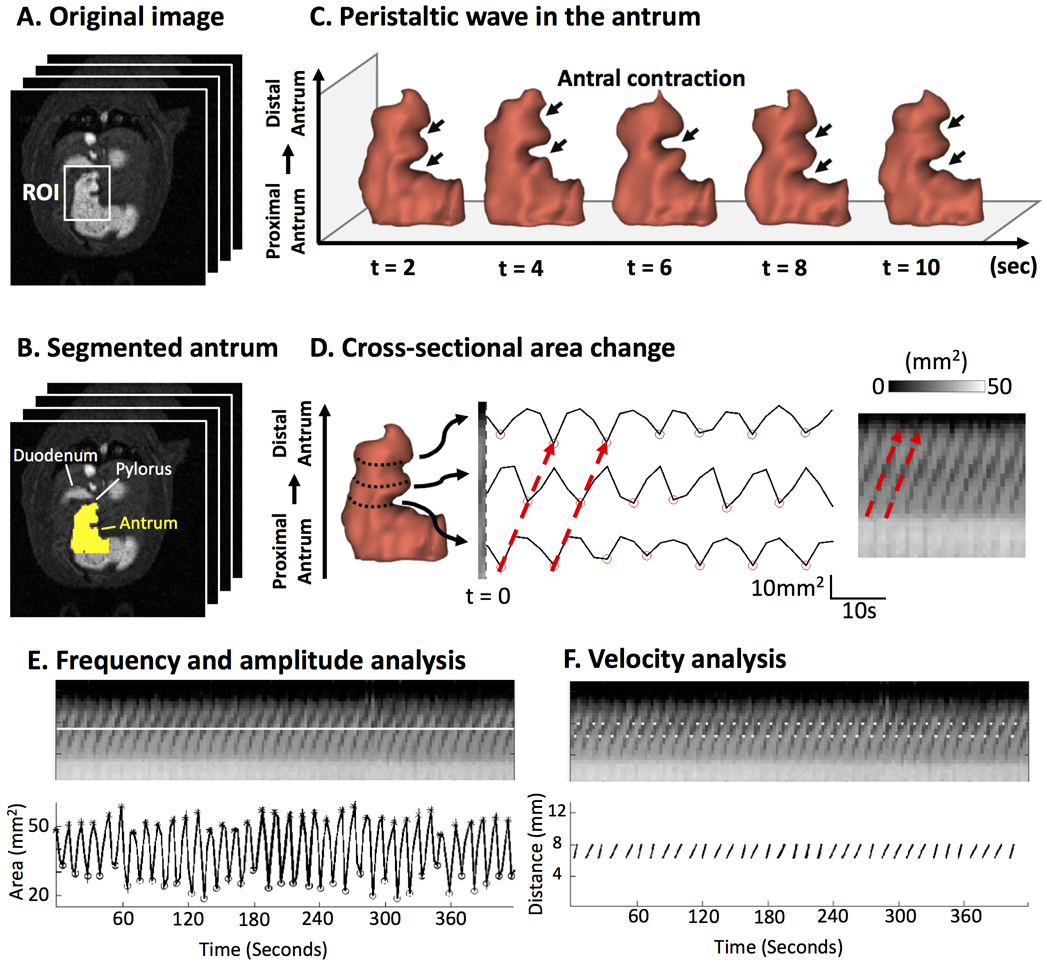
Fig. 3.

Image analysis of antral motility. A. Contrast-enhanced gastric MRI with fast sampling. B. Segmentation of the antrum. C. Temporal progression of the 3-D antral volume reveals the peristaltic wave. D. Changes in the cross-sectional area at different locations along the long axis of the antrum (from the proximal to the distal) are shown as time series or an image, both characterizing the antral motility. The red arrows mark the occurrence and progression of an antral contraction. E. The frequency and amplitude of the antral motility time series reveals the contraction frequency and amplitude. The distensions are marked with * and the contractions are marked with o. F. The spatial gradient of the phase of the motility time series reports the velocity of the peristaltic wave.
