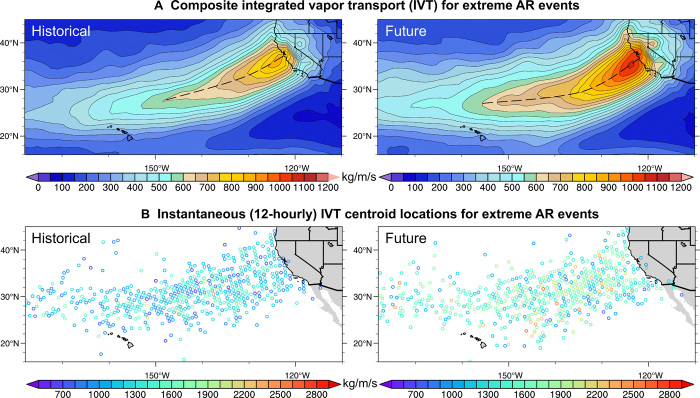
Fig. 1. Spatial distributions of moisture fluxes from the 60 historical (left) and future (right) AR events (WRF 81 km) under the RCP8.5 forcing scenario.
(A) Composite hourly instantaneous IVT map showing the moisture flux transport pattern averaged over each of the 60 ARs for each period at the time of maximum hourly precipitation over California. (B) Geographical distributions of the AR events, with each open circle denoting the locations at 12-hourly time intervals. The location is defined as the grid box with maximum IVT value; color shading denotes IVT magnitude.

