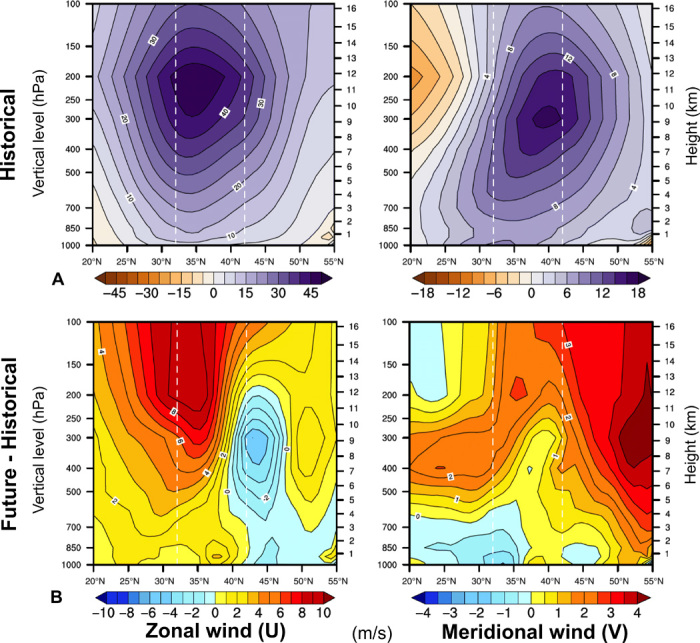
Fig. 2. Mean latitude-height cross section of zonal (left) and meridional (right) wind (near the coast at 130°W) for maximum AR precipitation days over California in CESM-LENS.

(A) Wind profiles for historical AR events. (B) Changes in wind profiles during future AR cases. The two white vertical dashed lines in each panel denote the lower and upper bounds of the latitude range of California.
