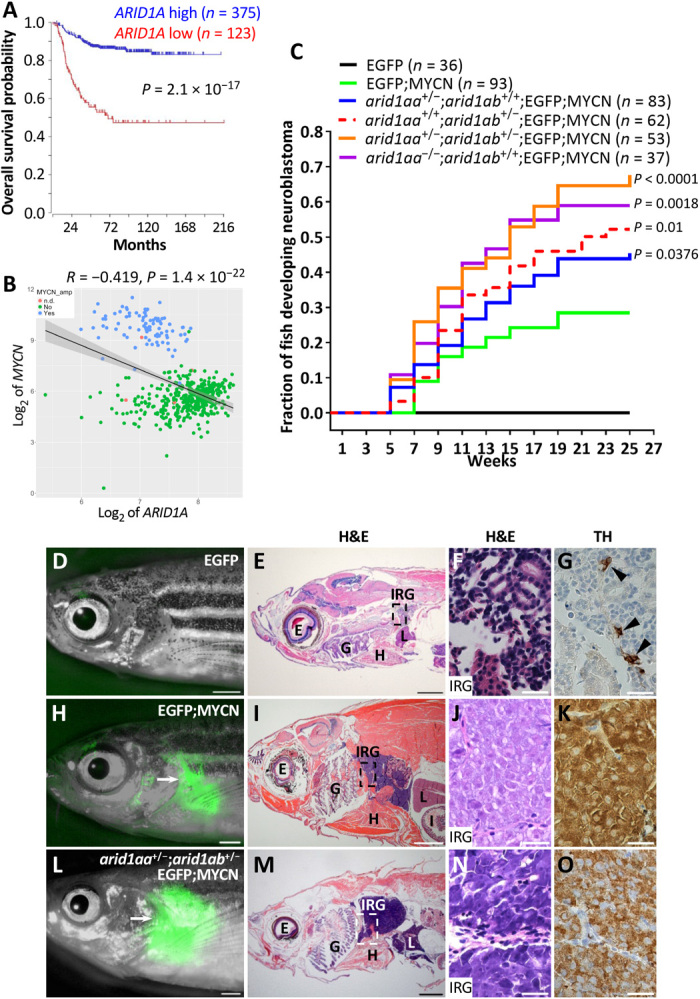
Fig. 1. Zebrafish arid1aa or arid1ab deficiency increases the penetrance of MYCN-induced neuroblastoma.

(A) Kaplan-Meier survival analysis according to ARID1A expression with chi-square test. The cutoff value of ARID1A expression levels was determined by the Kaplan scanner tool in R2 web application. (B) Correlation analysis between ARID1A and MYCN in human neuroblastomas. Tumors are categorized as MYCN-amplified (blue), MYCN-nonamplified (green), and MYCN status not determined (n.d.) (pink). Correlation coefficients (r) and statistical significance levels were determined by linear regression with lm method in R, and data were plotted using ggplot2 in R. Shaded area indicates 95% confidence interval. Data used in (A) and (B) were obtained from Tumor Neuroblastoma SEQC-498-RPM-seqcnb1 in R2 database. (C) Cumulative frequency of neuroblastoma onset among stable transgenic and mutant lines by Kaplan-Meier analysis. The overall differences between the curves for various mutant lines versus EGFP;MYCN line are compared by the log-rank test. (D to O) Lack of detectable EGFP expression in the IRG of a 17-wpf EGFP transgenic fish (D) and EGFP expression in the tumors (arrows) arising in the IRG of a 45-wpf EGFP;MYCN fish (H) and a 26-wpf arid1aa+/−;arid1ab+/−;EGFP;MYCN fish (L). Hematoxylin and eosin (H&E) staining and immunohistochemical staining of tyrosine hydroxylase (TH) of the sagittal sections through the IRG of each fish are shown on the right. E, eye; G, gill; H, heart; I, intestine; IRG, interrenal gland; L, liver. Scale bars, 1 mm (D, E, H, I, L, and M) and 20 μm (F, G, J, K, N, and O). Photo credit: Ting Tao, Dana-Farber Cancer Institute.
