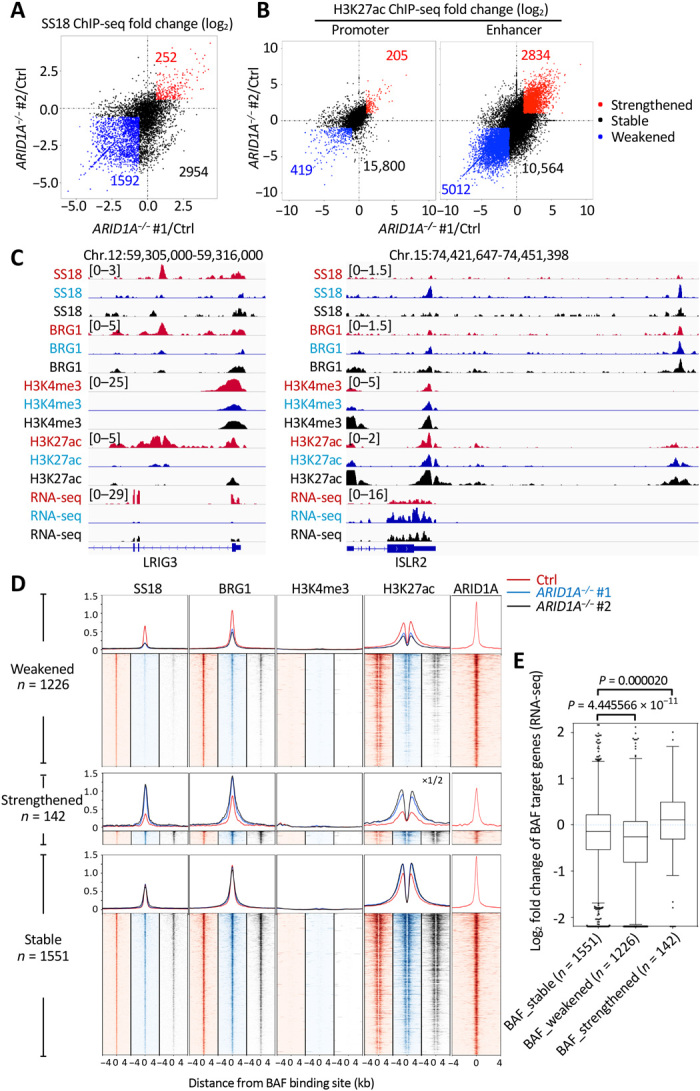
Fig. 4. Loss of ARID1A affects BAF complex targeting and regulation of enhancers.

(A) Fold change (log2) in SS18 ChIP-seq signals in ARID1A−/− #1 (x value) or ARID1A−/− #2 (y value) relative to control (Ctrl) NGP cells at each BAF binding site. Sites with weakened (<2/3×) signals in both ARID1A−/− #1 and ARID1A−/− #2 are indicated by blue, while sites with strengthened (>3/2×) signals in both ARID1A−/− #1 and ARID1A−/− #2 are indicated by red; others are indicated by black. (B) Fold change (log2) in H3K27ac ChIP-seq signals in ARID1A−/− #1 (x value) or ARID1A−/− #2 (y value) relative to control (Ctrl) NGP cells at each promoter and enhancer. Promoters or enhancers with weakened (<1/2×) signals in both ARID1A−/− #1 and ARID1A−/− #2 are indicated by blue, while sites with strengthened (>2×) signals in both ARID1A−/− #1 and ARID1A−/− #2 are indicated by red; others are indicated by black. (C) Example of SS18, BRG1, H3K4me3, and H3K27ac ChIP-seq tracks and RNA sequencing (RNA-seq) tracks at TSS-distal BAF weakened leucine rich repeats and immunoglobulin like domains 3 (LRIG3) locus (left) and strengthened immunoglobulin superfamily containing leucine rich repeat 2 (ISLR2) locus (right) in control (red), ARID1A−/− #1 (blue), and ARID1A−/− #2 (black) NGP cells. (D) ChIP-seq profiles and heat maps of SS18, BRG1, H3K4me3, and H3K27ac in control (red), ARID1A−/− #1 (blue), and ARID1A−/− #2 (black) NGP cells and of ARID1A in control NGP cells (red), around all TSS-distal BAF binding sites. (E) Log2 fold change of RPKM in RNA-seq between ARID1A mutants and control NGP cells for TSS-distal BAF target genes. Boxes indicate the median (horizontal line), 25th percentile, and 75th percentile; whiskers, distances from the largest and smallest value to each end of the box that are within 1.5× box length; dots, outliers. Data were analyzed with the Mann-Whitney test.
