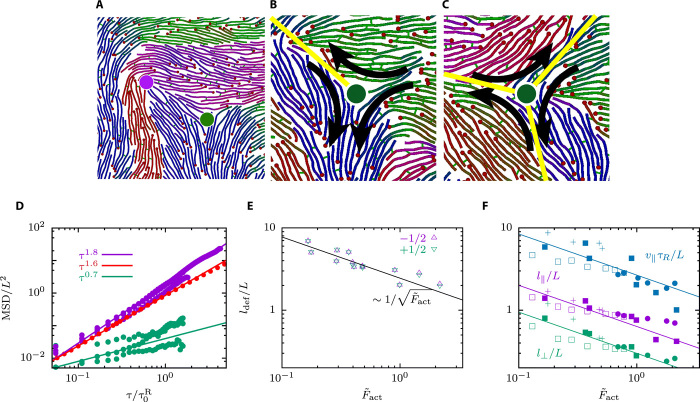
Fig. 4. Densities and MSDs of topological +1/2 and −1/2 defects.
(A) Snapshot of a pair of (green) and (magenta) defects. (B) Polar and nematic order near a defect with C1 symmetry. (C) Polar and nematic order near a defect with C3 symmetry. In (A) to (C), filament colors indicate the polar angle of filament orientation. In (B) and (C), the yellow lines indicate boundaries between polar domains. (D) MSD of the filament center-of-mass (red), defect (green), and defect (magenta). (E) Average distance between defects as a function of the active force. (F) Estimation of the domain size with three different approaches. Solid lines show the dependence and symbols simulations with datasets from the table in Fig. 1 with .

