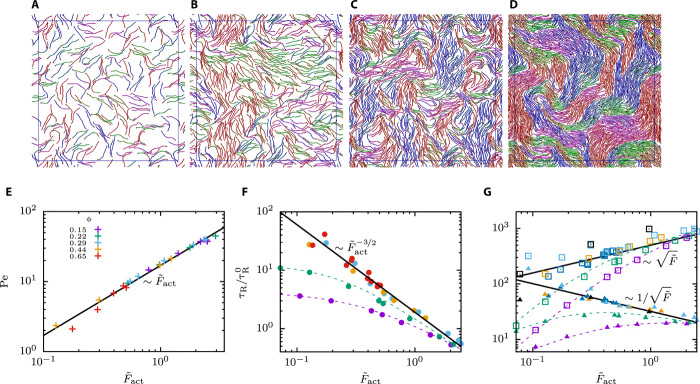
Fig. 5. Filament density–dependent structure formation and single-filament dynamics.
(A to D) Snapshots for systems at various densities, ϕ = (0.15, 0.29, 0.44, 0.66), where nm is varied to result in similar . (E to G) Dimensionless observables as a function of the active force for different area fractions. Symbols correspond to simulation data, dashed lines are used to guide the eye, and full lines indicate limiting power laws at large densities: (E) Peclet number, (F) active rotation time, (G) active diffusion coefficient (open squares), and domain size v∥τR (solid up-triangles). Colored labels in (E) refer to densities in (E) to (G). Black symbols in (G) correspond to simulations with longer filaments with .

