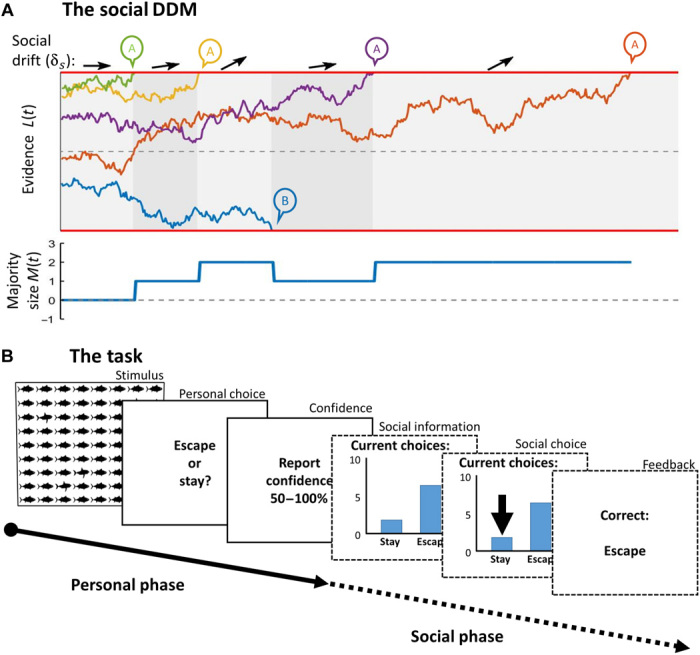
Fig. 1. Illustration of the social DDM and the experimental paradigm.

(A) A generic example of the social DDM with five individuals, each represented by a jagged line. The start point of each individual indicates the personal evidence accumulated up to that point. At the start, no individual exceeds the choice threshold, and social information is absent, implying no social drift (as indicated by the horizontal arrow). Individuals who begin close to either of the thresholds (red lines) are likely to choose early, providing social information for undecided individuals. This social information affects the rate of evidence accumulation, with the drift rate shifting toward the choice threshold favored by the majority (as indicated by the arrow pointing upward). (B) Stages of the predator detection task. During the personal phase, individuals briefly observe a grid of “sharks” and “tuna.” They then make a personal decision whether to “stay” or “escape” and report their confidence in that decision. In the subsequent social phase, they are asked to make a second decision on whether to “stay” or “escape,” but now, they can freely time their decisions and simultaneously observe the choices of others before doing so. Last, the correct answer is displayed, and the next trial begins (with 40 trials in total).
