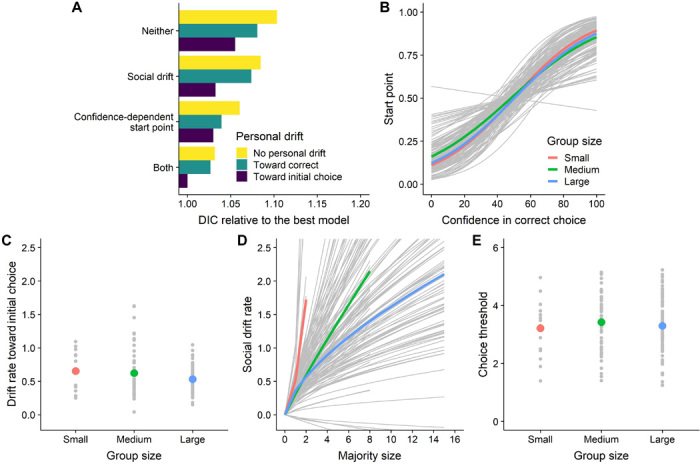
Fig. 4. Model comparison and individual- and group-level fittings of the social DDM for different group sizes.

(A) The DIC values of all models relative to the model with the lowest DIC. The model with the lowest DIC (i.e., preferred model) features a (i) confidence-dependent start point, (ii) drift toward the initially chosen option, and (iii) social drift. (B) Participants reporting higher confidence in the correct/incorrect choice started closer to the correct/incorrect choice threshold at y value of 1/0. (C) Evidence tended to drift toward the choice threshold of the option chosen during the personal phase. (D) The larger the majority favoring an option, the more strongly participants drifted toward the choice threshold favored by the majority. Participants in smaller groups had a stronger drift given the same majority size. (E) The choice threshold θ, reflecting a participant’s willingness to wait for social information, did not differ between group sizes. Gray lines/dots represent individual-level fittings; colored lines/dots represent the estimates on a group size level. Group size ranged from small (n = 3) to medium (n = 7 to 10), to large (n = 15 to 17).
