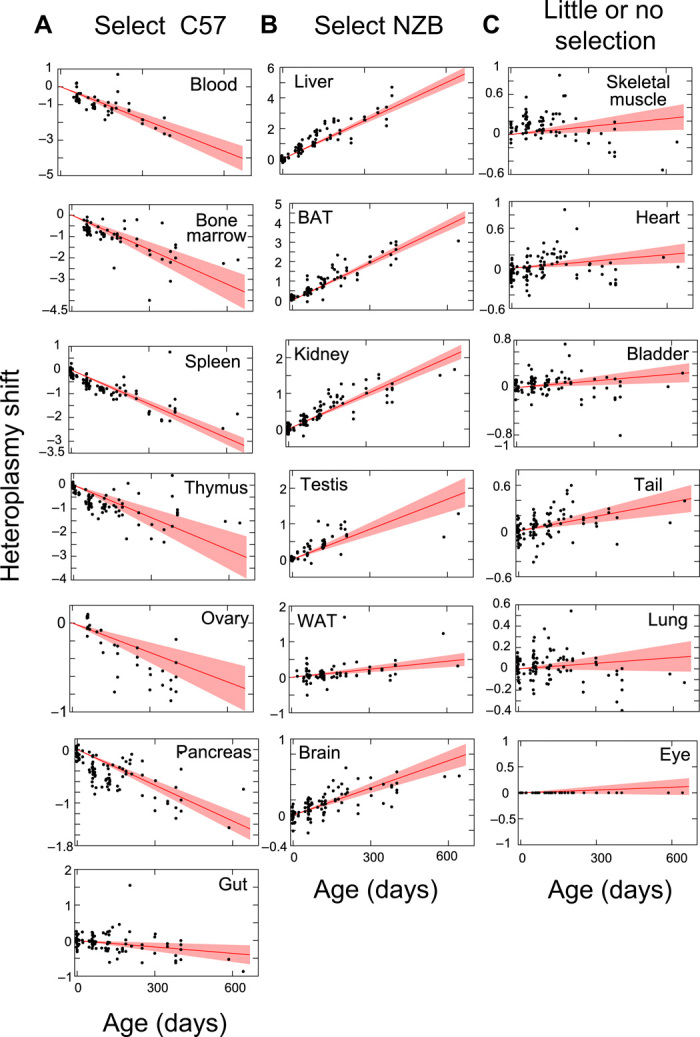
Fig. 1. Nonrandom segregation of wild-type mtDNA heteroplasmy.

Estimation of heteroplasmy shift for the indicated tissue from birth to more than 600 days old. (A) Tissues that shift toward C57 mtDNA. (B) Tissues that shift toward NZB mtDNA. (C) Tissues that do not resolve heteroplasmy or display very slow shifts. Red lines give inferred mean segregation behavior with 95% confidence intervals (n = 119 BL/6C57-NZB mice). Black dots show heteroplasmy data in the given tissue plotted relative to eye (see Materials and Methods), which is inferred to have a low segregation rate and is hence used as an approximate control tissue. Absolute values for each tissue are also shown in fig. S1.
