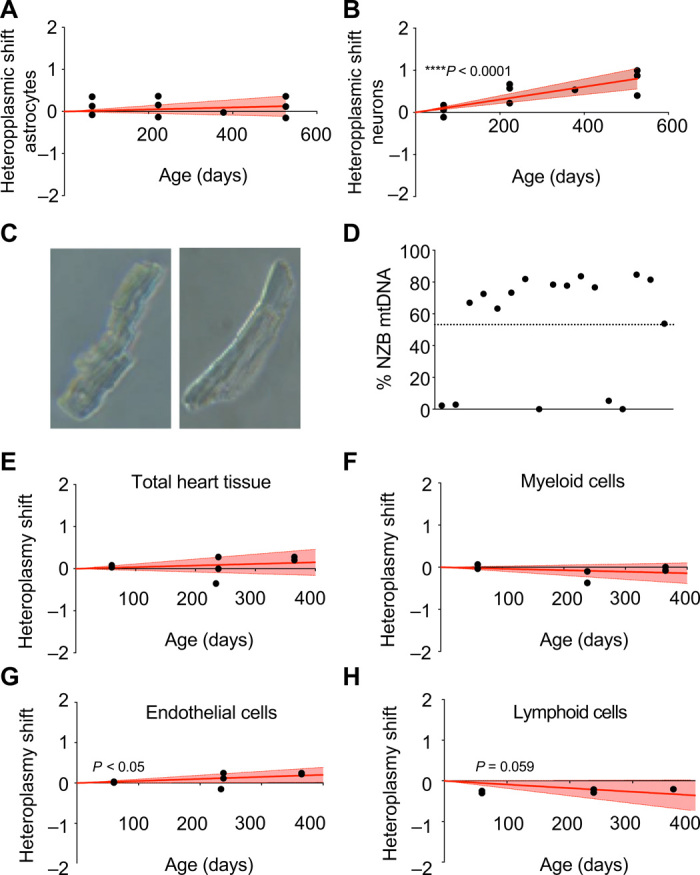
Fig. 3. Analysis of heteroplasmy in brain and cardiac cell populations.

(A and B) Transformed heteroplasmy shift in isolated astrocytes (A) and neurons (B) using tail as reference tissue. In (A) and (B), red lines correspond to the mean and discontinuous lines show 95% confidence intervals of inferred segregation trajectories. Each dot corresponds to a different animal at the indicated age. (C) Bright-field microscopy of single isolated adult cardiomyocytes. (D) Evaluation of intracellular mtDNA heteroplasmy in single cardiomyocytes from 20-week-old heteroplasmic mice (n = 4) Each dot corresponds to a different cardiomyocyte. Dotted line: average of entire tissue. (E to H) Evaluation of transformed heteroplasmy shift using tail as the reference tissue in isolated cardiac cell populations from heteroplasmic hearts at different ages. (E) Total cardiac tissue, (F) myeloid cells, (G) endothelial cells, and (H) lymphoid cells. Each dot corresponds to a different animal. *P < 0.05 and ****P < 0.0001, linear regression coefficient. (A, B, E, F, G, and H): positive toward mtDNA NZB and negative toward mtDNA C57.
