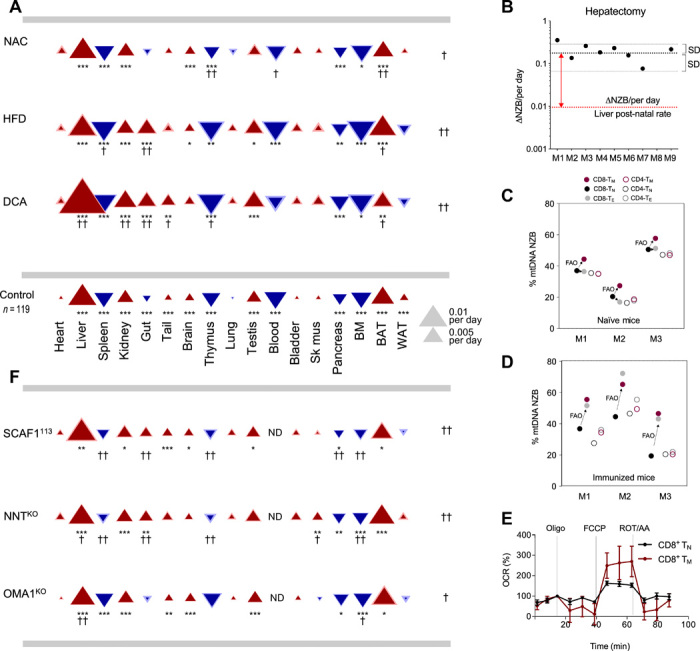
Fig. 4. mtDNA segregation is sensitive to modulation of organismal metabolism.

(A) Tissue-specific segregation patterns in basal and intervention conditions. Triangles indicate magnitude (size), s.e.m. (thickness of lighter border), and direction of the segregation toward NZB mtDNA (red, upward) or C57 mtDNA (blue, downward). Control: Segregation with no intervention. Experimental: Segregation resulting from chemical (A) and genetic (F) perturbations. DCA, n = 22 (age 57 to 159); NAC, n = 16 (age 96 to 273); HFD, n = 25 (age 59 to 188). (B) Rate of segregation of mtDNA in control (red line) and hepatectomized (black line) mice. (C and D) Heteroplasmy in different T cell subsets in 15-week-old (C) naïve and (D) immunized mice. Circles indicate CD8+ (filled) or CD4+ (open) T cells, and the colors indicate the different T cell subsets [naïve (TN), memory (TM), or effector (TE) T cells]. FAO, fatty acid oxidation; M, mouse. Data are representative of two independent experiments. (E) Oxygen consumption rate (OCR) Seahorse profiles for indicated cells (n = 5 BL/6C57-NZB). Oligo, oligomycin; FCCP, carbonilcyanide p-triflouromethoxyphenylhydrazone; ROT, rotenone; AA, antimycin. (F) Tissue-specific segregation patterns in heteroplasmic mouse with the indicated nuclear genetic variations. ND, not described. BL/6C57-NZB:NNTKO: n = 27 ovaries, n = 16 testes, and n = 25 rest of the tissues. BL/6C57-NZB:SCAF1113: n = 11 ovaries, n = 10 testes, and n = 20 to 21 for the rest of the tissues. BL/6C57-NZB:OMA1KO: n = 11 ovaries, n = 11 testes, and n = 14 to 16 for the rest. In (A) and (F), †P < 0.05 and ††P < 0.01, at the side for significance affecting the overall pattern of segregation and under triangles for significance at individual tissues. Asterisks: Significant differences from zero segregation (bootstrap percentile method with Bonferroni correction; *P < 0.05, **P < 0.01, and ***P < 0.001).
