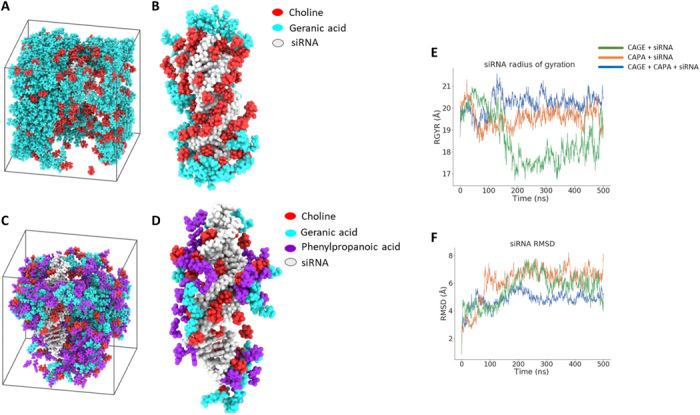
Fig. 2. MD simulation identifies the extent of IL-siRNA interaction for enhanced solvation and stability.

(A and B) Snapshot of simulation unit cell for CAGE and siRNA (A) and CAGE components found within 10 Å of siRNA (B) under periodic boundary conditions for 500 ns. (C and D) Snapshot of simulation unit cell for the optimized IL combination (CAGE and CAPA, 1:1) and siRNA (C) and IL species found within 10 Å of siRNA (B) under similar conditions. (E and F) Radius of gyration (RGYR) (E) and root mean square deviation (RMSD) (F) obtained over the course of 500 ns for CAPA and the IL combination (CAGE and CAPA) in contrast to CAGE (control).
