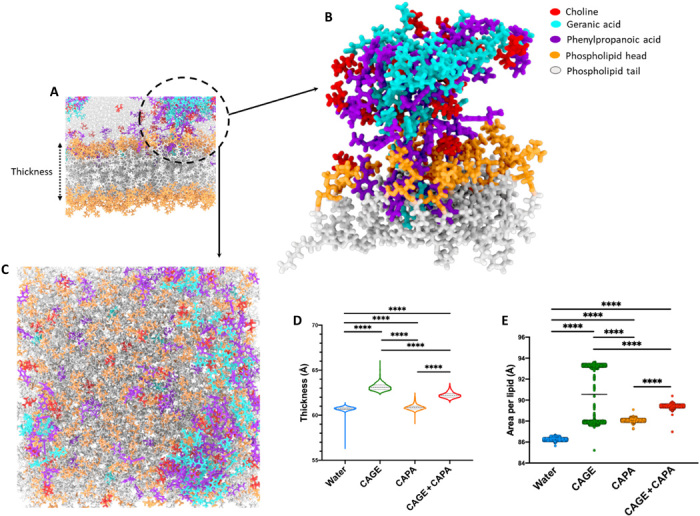
Fig. 3. MD simulations establish enhanced lipid bilayer interactions and translocation mechanisms of the IL combination.

(A) Lipid bilayer simulation with the aggregates of choline, geranic acid, and phenylpropanoic acid highlighted with a circle. (B) Enlarged view of the ionic species from the circle depicting closed interaction of ionic species with the phospholipid heads and tails. The aggregate contains all three ionic species contributing to the interaction with the lipid membrane. (C) Representative snapshot viewing perpendicular to membrane in the plane of the lipid bilayer. (D and E) Average thickness of the lipid membrane (D) and average area per lipid (E) over the course of simulations in the presence of CAPA and the IL combination (CAGE and CAPA) in contrast to CAGE (control). All data are averages ± SEM and were determined to be nonparametric by normality test and statistics by Kruskal-Wallis test for (D) and (E). ****P < 0.0001.
