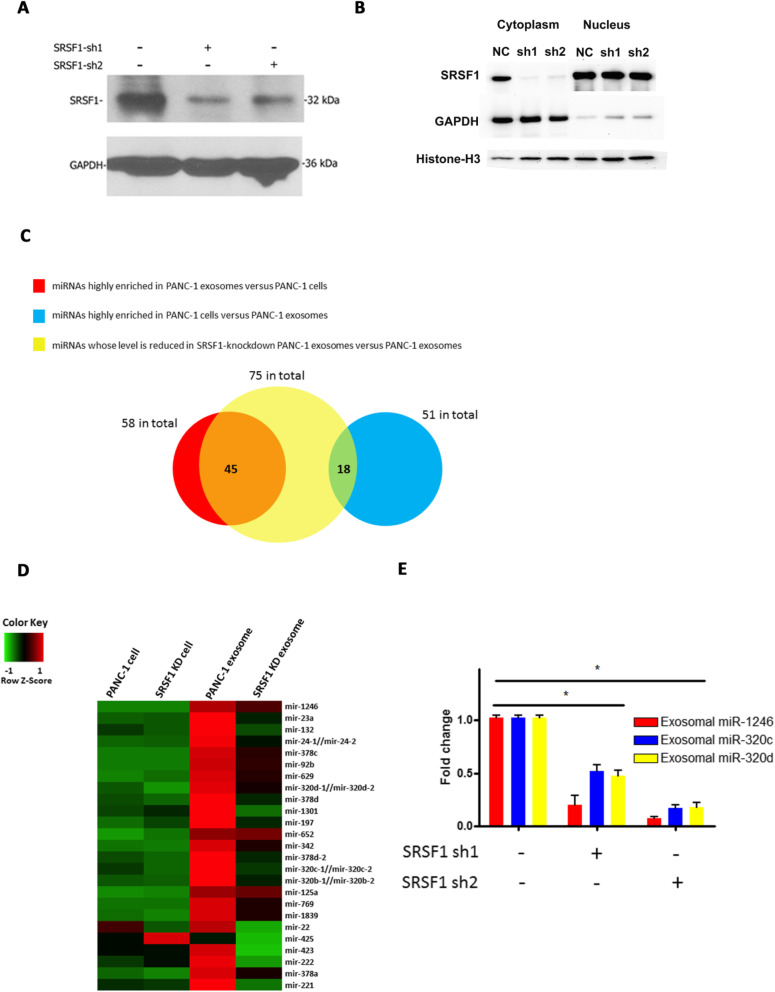
Fig. 3.
Cellular and exosome miRNA profiles after SRSF1 knockdown in PANC-1 cells. a Detection of SRSF1 knockdown by shRNAs in PANC-1 cells. b PANC-1 SRSF1 protein levels in nuclear and cytoplasmic fractions (NC: normal control). c Venn Diagram of overlap of miRNAs detected by next generation small RNA sequencing in SRSF1 knockdown and control PANC-1 cells and exosomes. d Heatmap showing the expression of top 25 exosome miRNAs in cells and exosomes after SRSF1 knockdown. e qRT-PCR analysis of miR-1246, miR-320c and miR-320d in exosomes derived from control and SRSF1 knockdown PANC-1 cells (*p < 0.001, Student’s t-test). Shown are representatives of three independent experiments (a-e)

