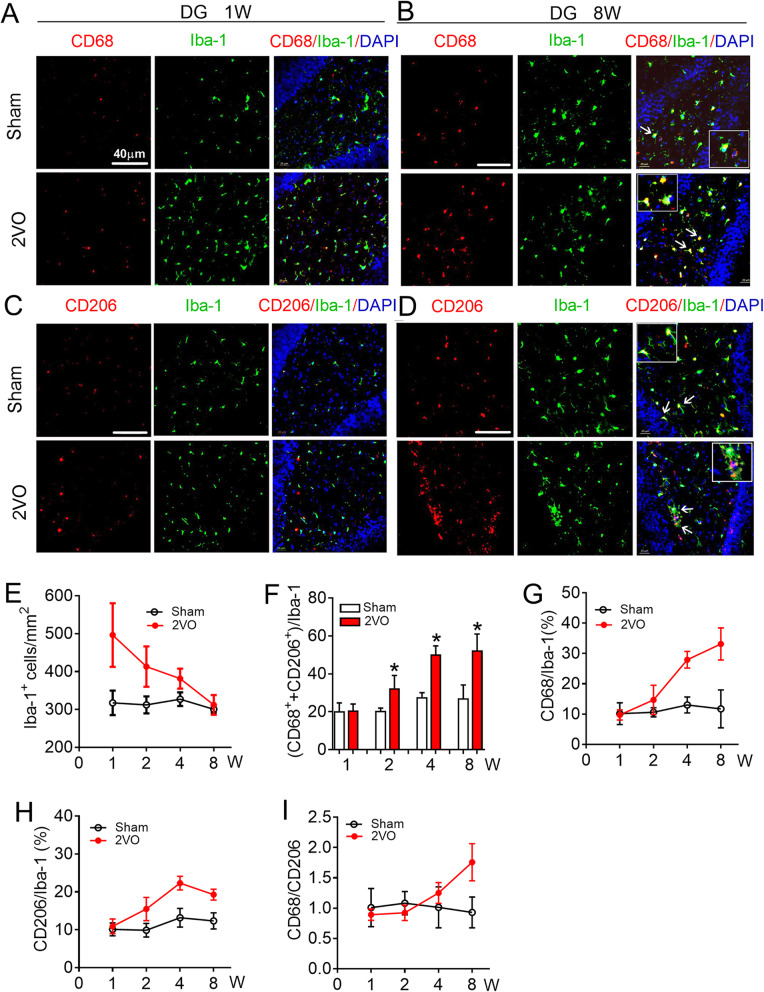
Fig. 1.
Microglial/macrophage activation and polarization in the dentate gyrus (DG) region of 2VO rats. a, b Representative images of CD68 expression in Iba-1+cells in hippocampal DG region of sham and 2VO rats at 1 week (a) and 8 weeks (b). c, d Representative images of CD206 expression in Iba-1+cells in hippocampal DG region of sham and 2VO rats at 1 week (c) and 8 weeks (d) by immunofluorescence staining. Scale: 40 μm. e Quantification of the Iba-1+ cell number in hippocampal DG region. f Quantification of the total polarized microglia/macrophage number in hippocampal DG region. g Quantification of the ratio of CD68 in Iba-1+cells in hippocampal DG region. h Quantification of the ratio of CD206 in Iba-1+ cells in hippocampal DG region.i Quantification of the ratio of CD68 and CD206 in hippocampal DG region. Values are mean ± SD, n = 9 slices from 3 animals per group, *P < 0.05 vs sham group, Student’s t test

