Fig. 3.
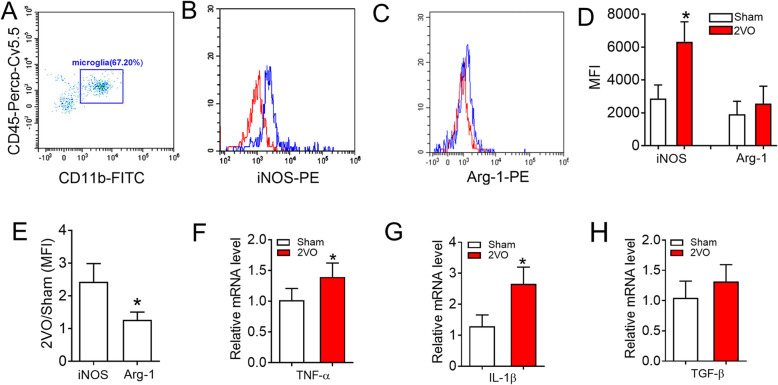
CBH induces microglial polarization toward M1 phenotype and inflammatory responses in 2VO rats after 8 weeks. a Representative dot plots of CD11b/CD45 cells detected by flow cytometry. Microglia cells within the gate were used for iNOS/Arg-1 analysis. b Representative histograms of the mean fluorescent intensity (MFI) for iNOS in sham (red) and 2VO (blue) rats. c Representative histograms of the MFI for Arg-1 in sham and 2VO rats. d Quantification of MFI for iNOS/Arg-1 from sham and 2VO rats. Bars represent the mean ± SD. n = 3, cells were pooled from 3 rats per group for a total of 3 separate experiments for each time point. *P < 0.05 vs sham group, Student’s t test. e The MFI ratio between 2VO and sham rats for the expression of iNOS/Arg-1. Bars represent the mean ± SD. n = 3, cells were pooled from 3 rats per group for a total of 3 separate experiments for each time point. *P < 0.05 vs iNOS, Student’s t test. f The mRNA expression of TNF-α in the hippocampus of 2VO rats. g The mRNA expression of IL-1β in the hippocampus of 2VO rats. h The mRNA expression of TGF-β in the hippocampus of 2VO rats. Bars represent the mean ± SD. n = 6. *P < 0.05 vs sham group, Student’s t test

