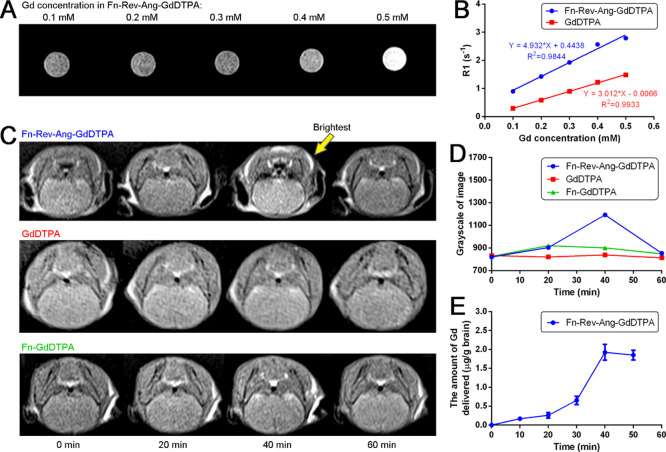
Figure 5.
(A) T1 MR imaging in a 2 mL centrifuge tube of Fn-Rev-Ang-GdDTPA containing various concentrations of Gd. (B) Relaxation time of Fn-Rev-Ang-GdDTPA vs free GdDTPA. Linear regression was used with R2 reported. (C) In vivo T1 MRI of Fn-Rev-Ang-GdDTPA, GdDTPA, and Fn-GdDTPA following i.v. administration in healthy mice. (D) Brain T1 MRI signal intensity changes over time after i.v. administration of Fn-Rev-Ang-GdDTPA, GdDTPA, and Fn-GdDTPA. The y axis represents the grayscale of image. (E) Time-course of the expression of Gd in mouse brains following i.v. injection of Fn-Rev-Ang-GdDTPA, as assessed by ICP–MS.

