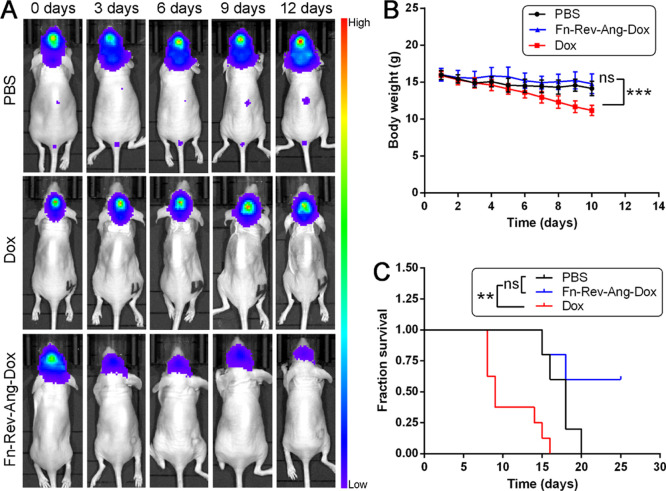
Figure 7.
(A) Bioluminescence imaging showing the antitumor effect over time of Fn-Rev-Ang-Dox (bottom row) compared to PBS and Dox injected iv or intracerebroventricular into glioma-bearing mice. (B) Body weight change in the PBS, Fn-Rev-Ang-Dox, and Dox groups. Data are presented as mean ± SD (n = 5–8). One-way ANOVA and Tukey’s multiple comparison test were performed on groups of day 10. (C) Average change in the body weight after treatment. The log-rank (Mantel–Cox) test was used for comparisons of survival curves. ns: not significant (p > 0.05). **p < 0.01. ***p < 0.001.

