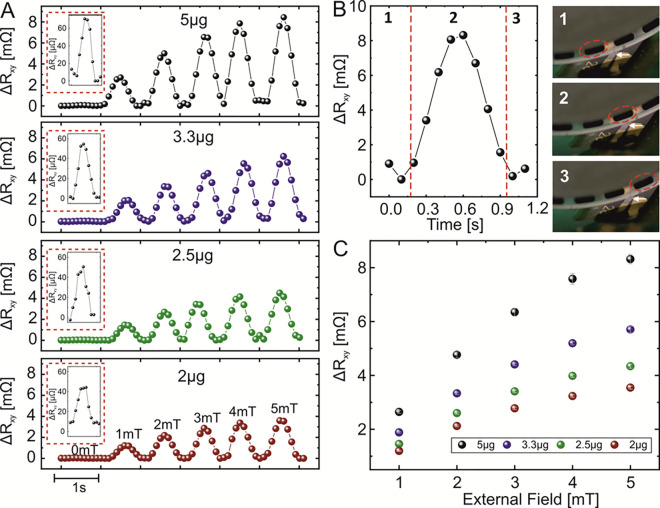
Figure 2.
(A) Composite plot showing the sensor readout for a single representative droplet (volume of 100 nL) possessing different concentrations of ferrofluid (weight is indicated in each subpanel) biased to different magnetic fields. The data for each droplet is taken from a measured sequence shown in Figure S4. Insets show zoomed views of the sensor response when droplets are biased to the geomagnetic field. (B) Close-up of the time evolution of the sensor response during the event when a single droplet (5 μg; 5 mT bias) passes above the sensing area. Insets show selected frames of a video sequence (Video S1) at the instances when the droplet (B-1) approaches the sensor, (B-2) is above the sensor, and (B-3) departs from the sensor location. (C) Summary of the maximum sensor responses measured for droplets containing different concentrations of ferrofluid and biased to various magnetic fields.

