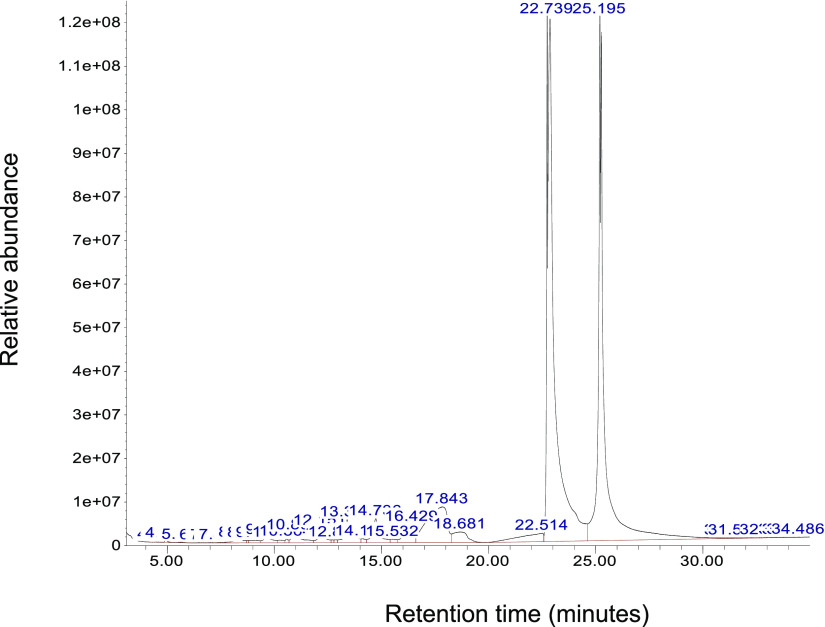
Figure 4.
GCMS chromatogram of the vessel area at chick embryonic day 1. One gram of white area was collected and extracted using an organic solvent mixture. Molecules in the white area were analyzed using GCMS to identify molecular weight and fragmentation patterns. Two distinct peaks at 22 and 25 min were further analyzed for the second mass spectrum for m/z values for the molecular ion peak (M+) and the tallest base peak. The X-axis represents retention time (minutes), and the Y-axis shows relative abundance.

