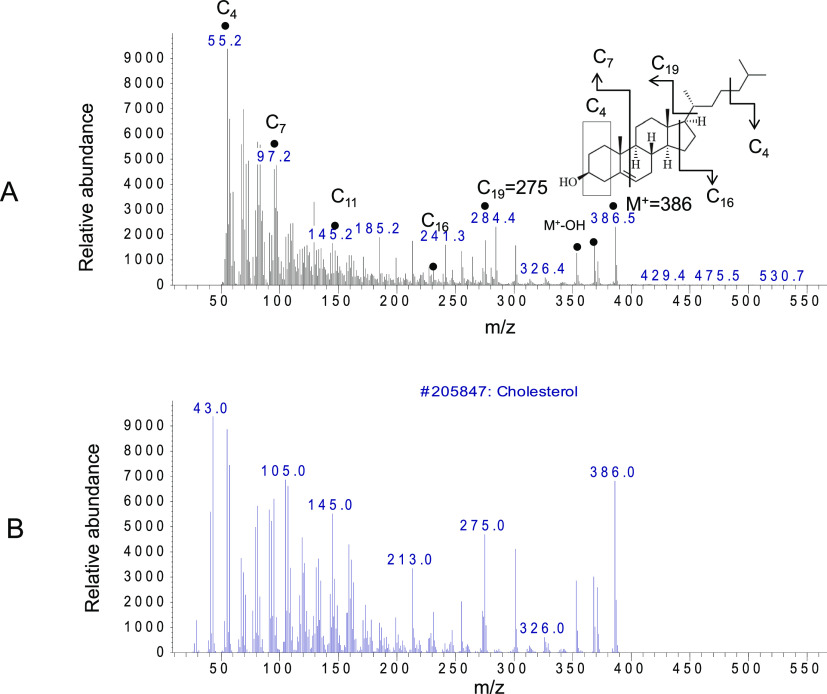
Figure 7.
GCMS analysis of the vessel area at 25 min. (A) Molecules in the white circular area at 25 min were analyzed by their molecular weight and fragmentation pattern. Fragmentation pattern of the major peaks are assigned as follows: C4 = 55, C7 = 97, C11 = 145, C16 = 231, 241, C19 = 275, M + −OH = 369, and molecular ion as M+ (C27) = 386. (B) Database search identified the unknown molecule as cholesterol, as a positive control. m/z values of all fragments were compared to an authentic sample of cholesterol (not shown) and the known spectrum of cholesterol from the database.

