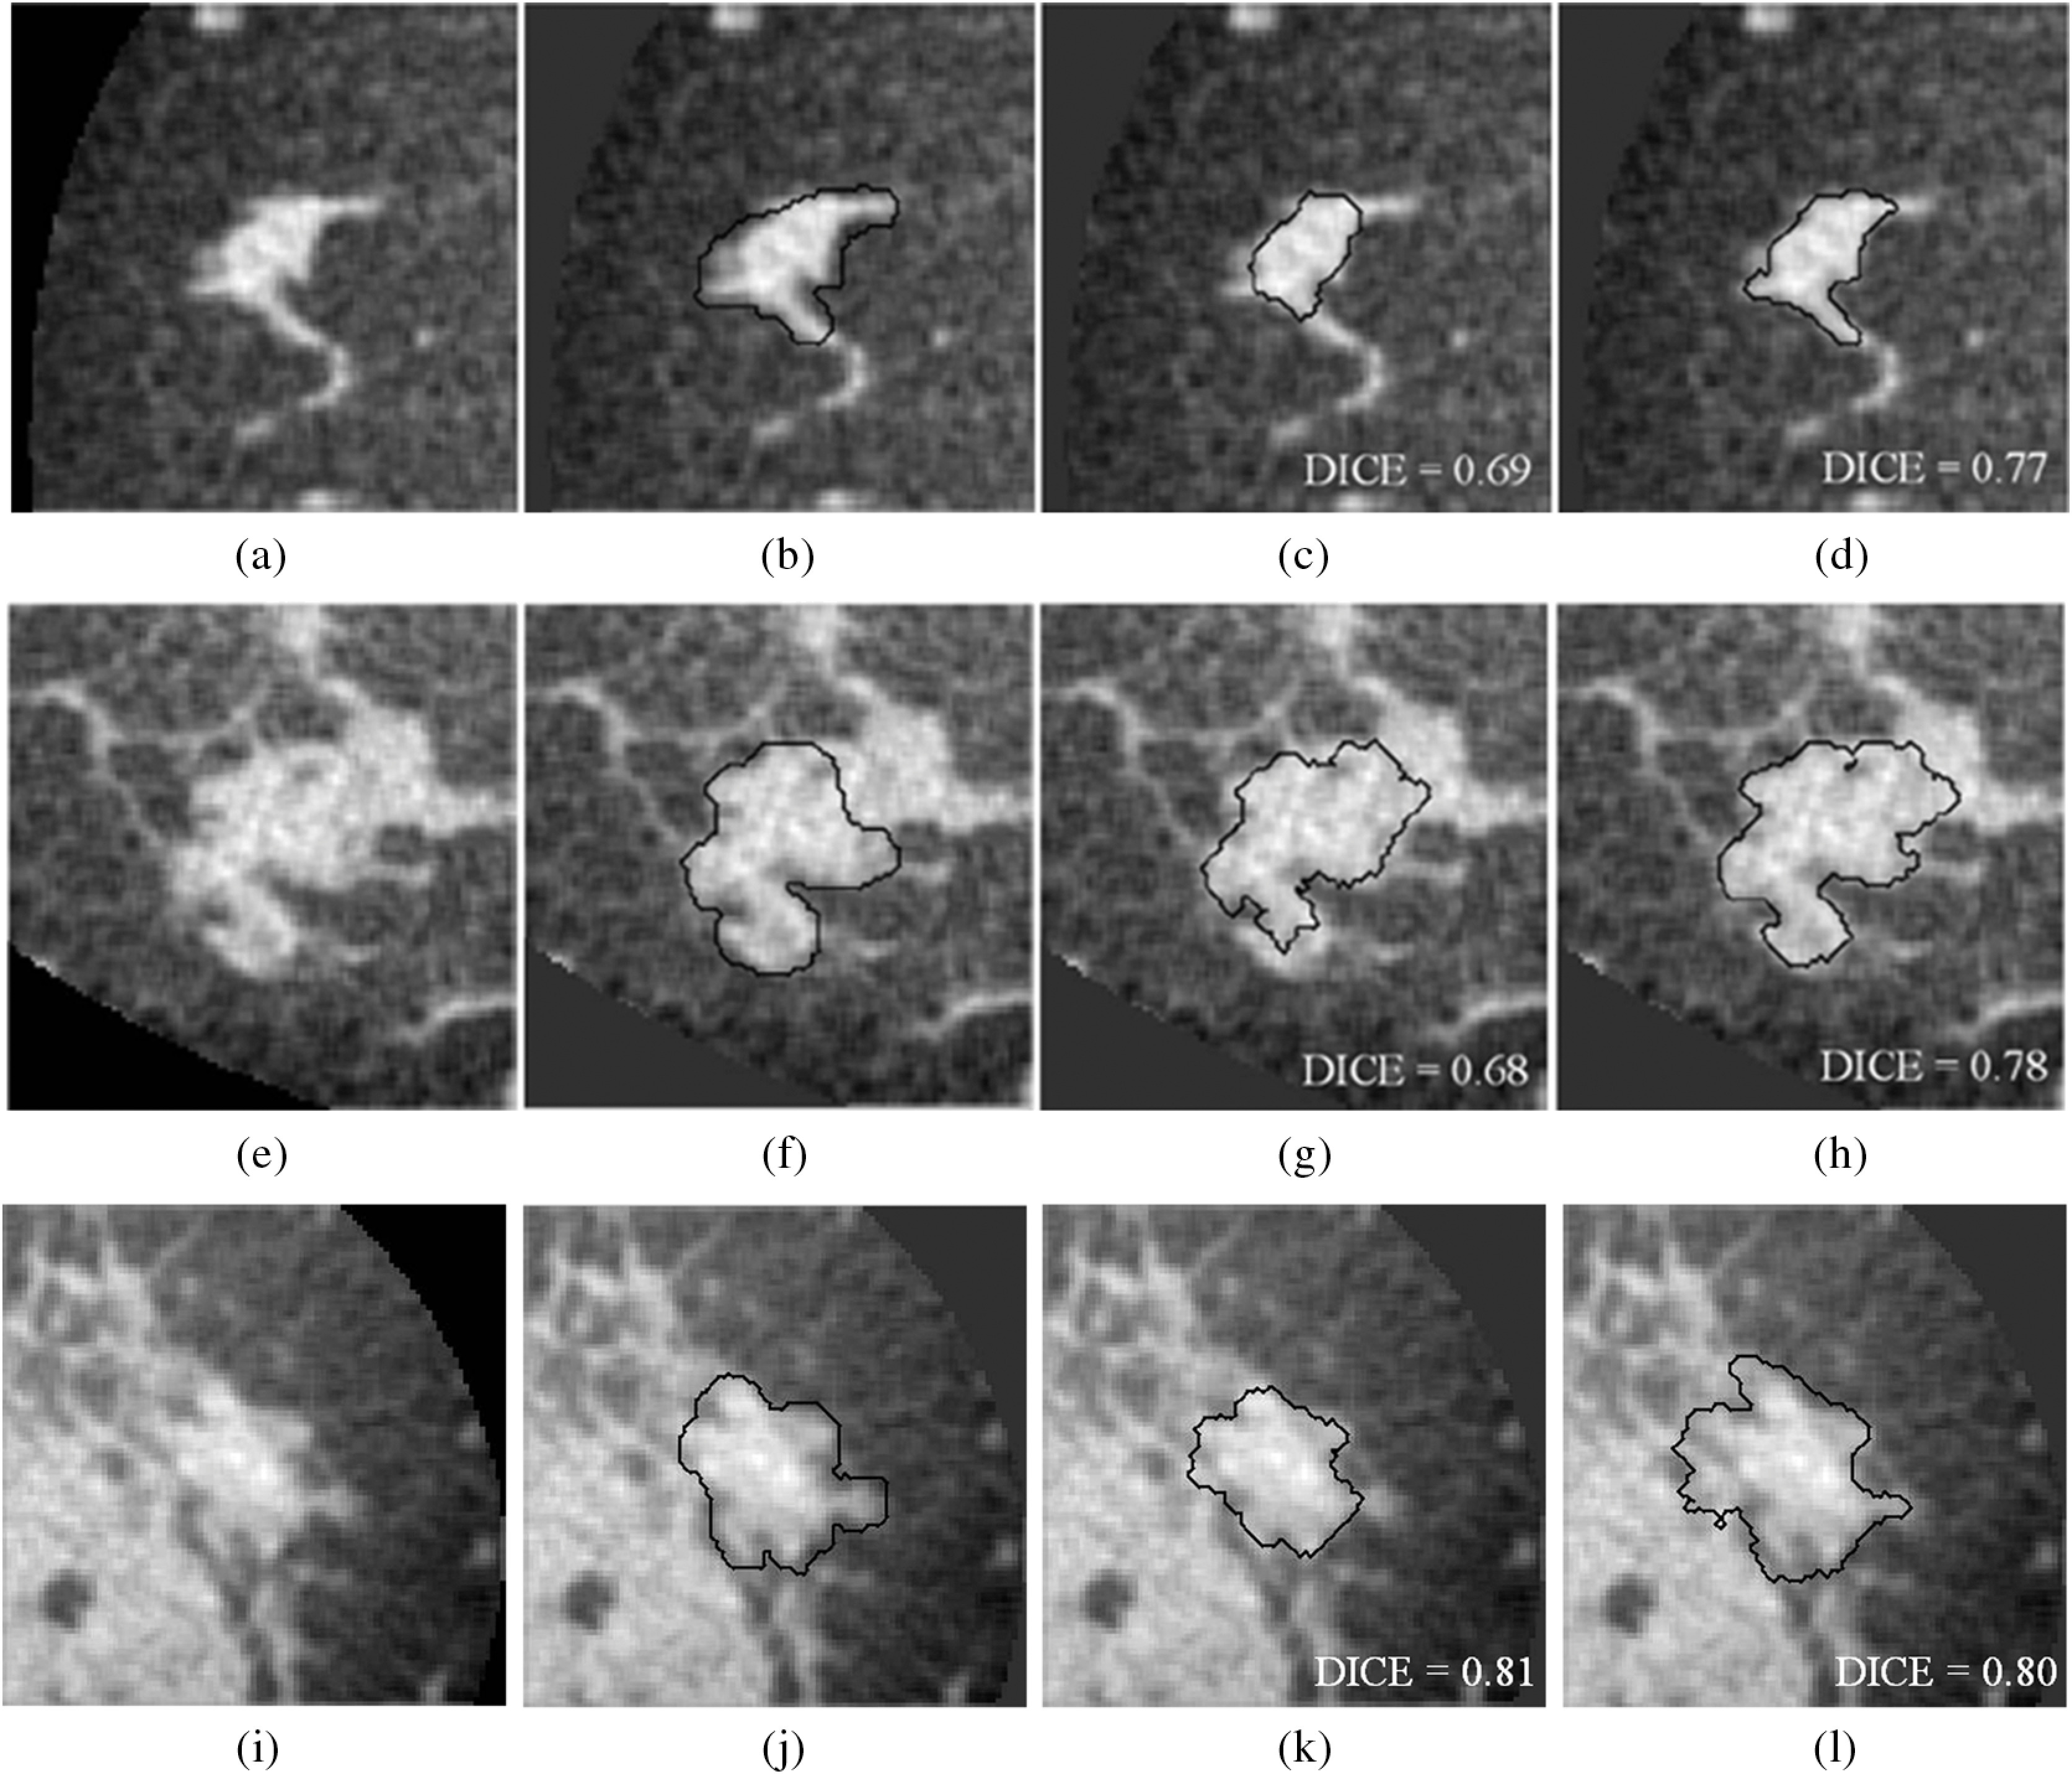
Fig. 8.

Three different noncontrast bCT segmentation examples for each of the fibroglandular density classes. (a–d) 8% of fibroglandular proportion (low density). (e–h) 29% fibroglandular proportion (intermediate density; this lesion is also depicted in Fig. 7). (i–l) 46% fibroglandular proportion (high density). (b, f, and j) Research specialist’s outlines. (c, g, and k) Segmentation results by previous procedure. (d, h, and l) Segmentation results by proposed procedure.
