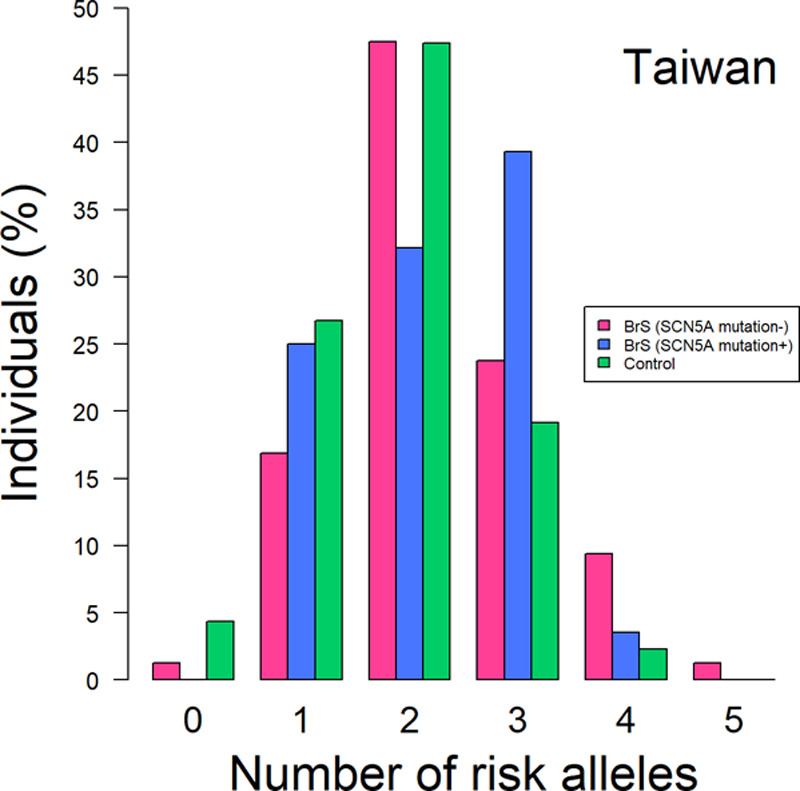
Figure 3.

The distribution of the risk alleles in the Taiwanese Brugada syndrome (BrS) patients and healthy controls. The BrS patients were divided into 2 groups based on whether they possessed SCN5A mutations or not. The x axis shows the number of risk alleles in one individual, whereas the y axis shows the percentage of the people with the alleles.
