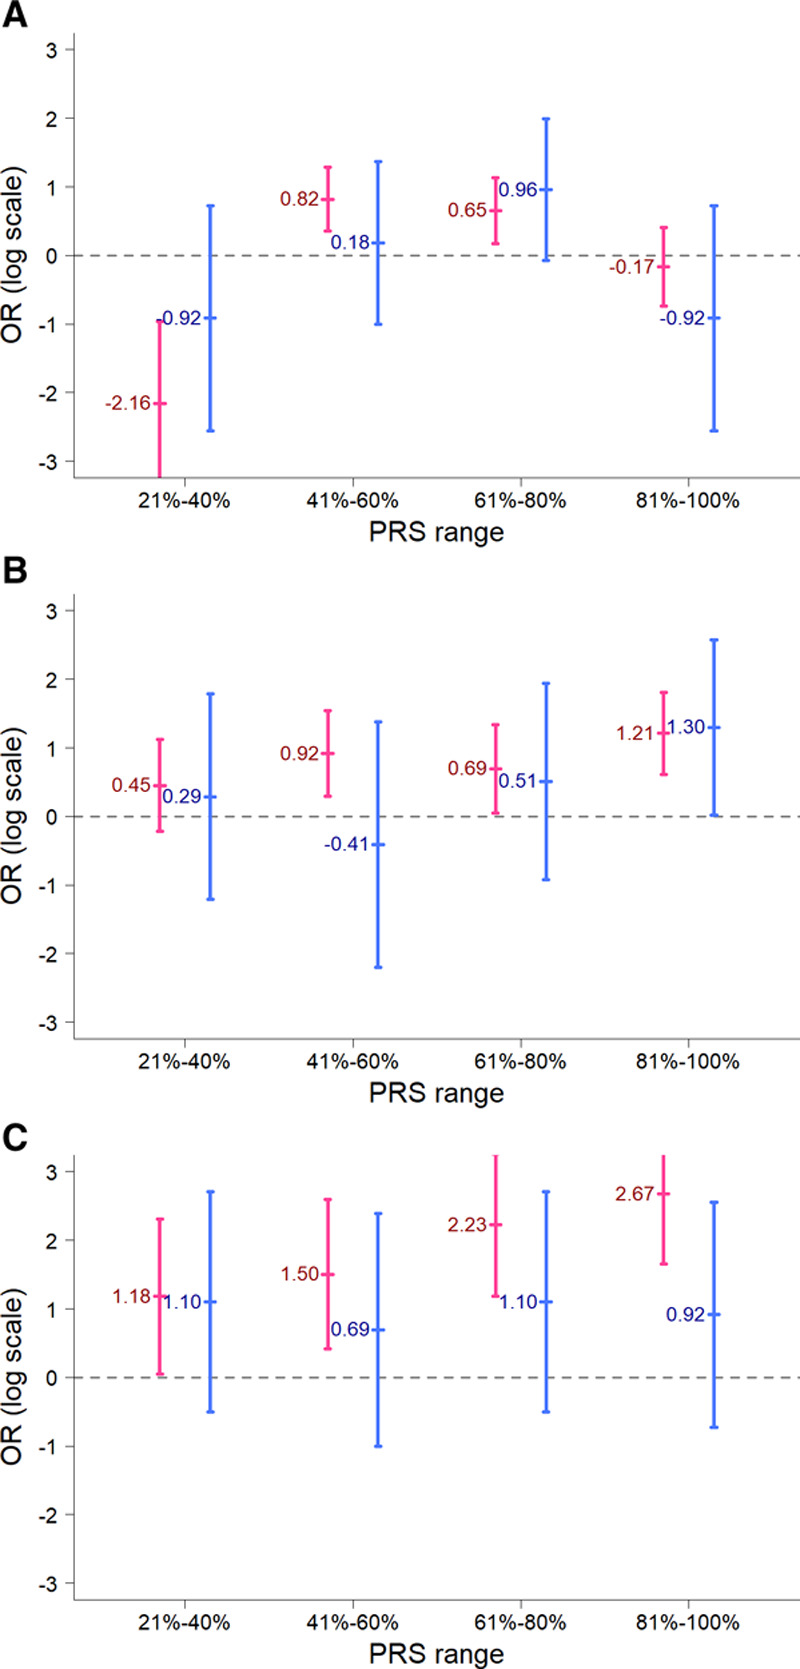
Figure 4.

Comparisons of the odds ratios for the polygenic risk score (PRS) models between the Taiwanese Brugada syndrome (BrS) patients with and without SCN5A mutations. The x axis shows the ranges of PRS scores in the BrS patients, whereas the y axis shows the odds ratios on a log scale. A, The PRS model developed using the 3 single-nucleotide polymorphisms (SNPs; set 1, BrS-PRS14); (B) the PRS model was developed using the 8 SNPs from set 2 (rs6599257, rs11129801, rs10428132, rs7428167, rs7641844, and rs7430439 in chromosome 3 and rs1268070 and rs9388451 in chromosome 6); (C) the PRS model developed using the 75 SNPs (set 3). The BrS patients were divided into 2 groups based on whether they had pathogenic SCN5A mutations (blue color) or not (red color).
