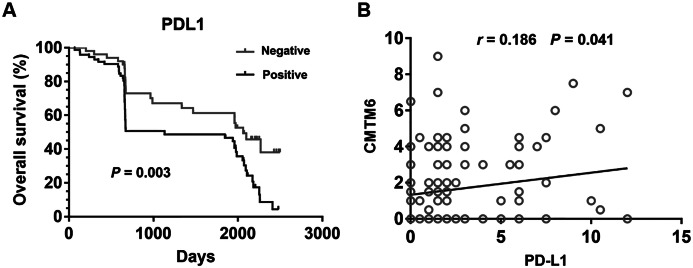
Figure 3. Relationship between CMTM6 and PD-L1 in GC.
(A) Kapla–Meier analysis of overall survival (OS) with variable PD-L1 expression in GC patients. The black curve represents PD-L1 positive expression group, and the gray curve represents PD-L1 negative expression group. (B) The correlation of CMTM6 and PD-L1 expression in the GC tissues.

