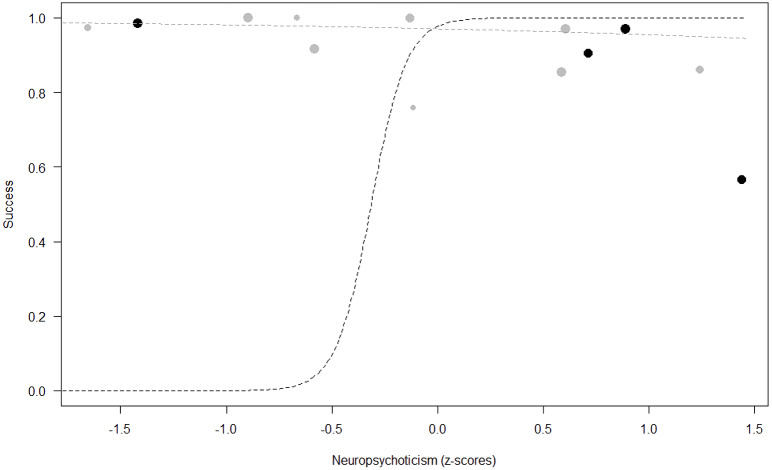
Figure 4. Probability of success as a function of Neuropsychoticism.
The dots represent the individuals tested (females in black, males in grey), with their size being proportional to the number of trials in which they participated. The dashed lines depict the models, which have been back-transformed from the log-odds ratio scale (black for females, grey for males).

