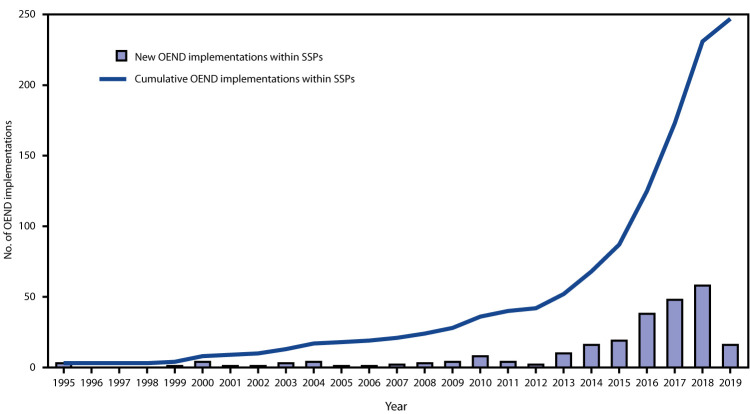
FIGURE 1.
Number of new and cumulative overdose education and naloxone distribution (OEND) implementations within syringe service programs (SSPs),*,† by year — United States, 1995–2019
* Data displayed are derived using responses from 263 of 342 SSPs throughout the United States.
† Participating SSPs were identified by using the North America Syringe Exchange Network database.

