
Figure 3. Proteomic analysis of dCas9‐purified var gene introns and promoters.
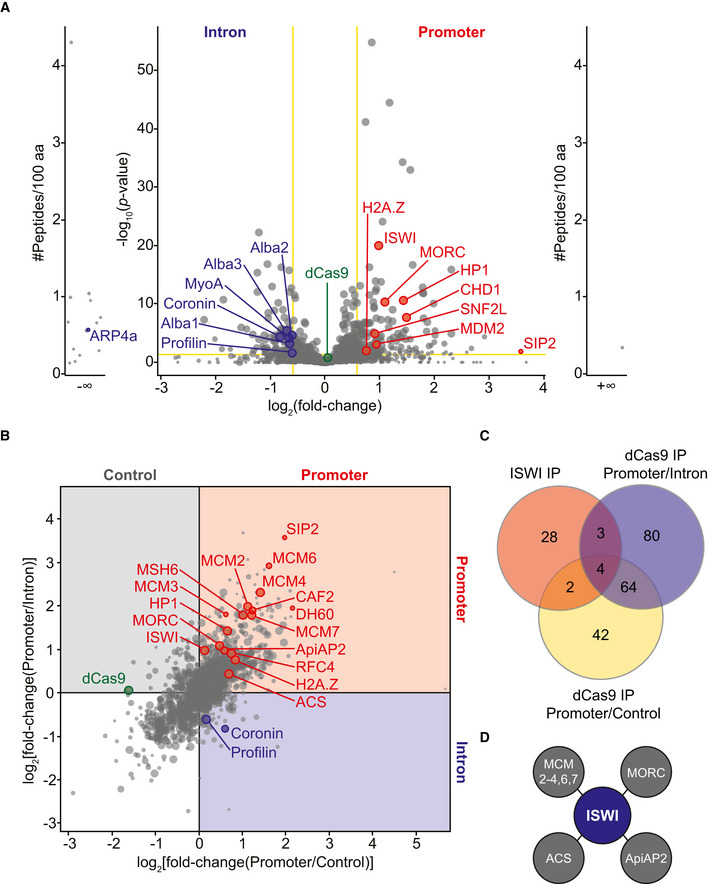
- Volcano plot representation of label‐free quantitative proteomic analysis of P. falciparum proteins present in intron‐ (left) and promoter‐targeted (right) dCas9 immunoprecipitations. Each dot represents a protein, and its size corresponds to the sum of peptides from both conditions used to quantify the ratio of enrichment. For the main volcano plot, x‐axis = log2(fold‐change), y‐axis = −log10(P‐value), horizontal yellow line indicates adjusted P‐value = 0.05, and vertical yellow lines indicate absolute fold‐change = 1.5. Side panels indicate proteins uniquely identified in either sample (y‐axis = number of peptides per 100 amino acids). dCas9 protein is highlighted in green for reference. Two replicates were used for the promoter‐targeted dCas9, and four replicates were used for the intron‐targeted dCas9. Fold enrichment and adjusted P‐values for each protein highlighted in red (promoter) and blue (intron) can be found in [Link], [Link], respectively.
- Correlation plot of label‐free quantitative proteomic analysis of P. falciparum proteins enriched in promoter‐targeted (top right quadrant in red) versus non‐targeted control (top left quadrant in gray) or intron (bottom right quadrant in blue) dCas9 immunoprecipitations. Each dot represents a protein, and its size corresponds to the sum of peptides from both conditions used to quantify the ratio of enrichment. The x‐axis = log2(fold‐change[promoter/non-targeted control]) and y‐axis = log2(fold‐change[promoter/intron]). dCas9 protein is highlighted in green for reference. Two replicates were used for the promoter‐targeted dCas9, and four replicates were used for the intron‐targeted and non‐targeted dCas9. Fold enrichment and adjusted P‐values can be found for each protein highlighted in red (promoter) in Tables EV5 (intron comparison) and EV7 (control comparison) and for each protein highlighted in blue (intron) in Tables EV6 (promoter comparison) and EV8 (control comparison).
- Venn diagram comparing proteins enriched in the ISWI IP LC‐MS/MS (red) and the promoter‐targeted dCas9 IP LC‐MS/MS compared to the intron‐targeted dCas9 (blue) or the non‐targeted dCas9 (yellow).
- Schematic of proteins shared between the ISWI IP LC‐MS/MS and the promoter‐targeted dCas9 IP LC‐MS/MS (overlapping regions shown in C): ISWI (PF3D7_0624600), MORC (PF3D7_1468100), ApiAP2 (PF3D7_1107800), MCM2‐4,6,7 (PF3D7_1417800, PF3D7_0527000, PF3D7_1317100, PF3D7_1355100, PF3D7_0705400), and acetyl‐CoA synthetase (ACS, PF3D7_0627800).