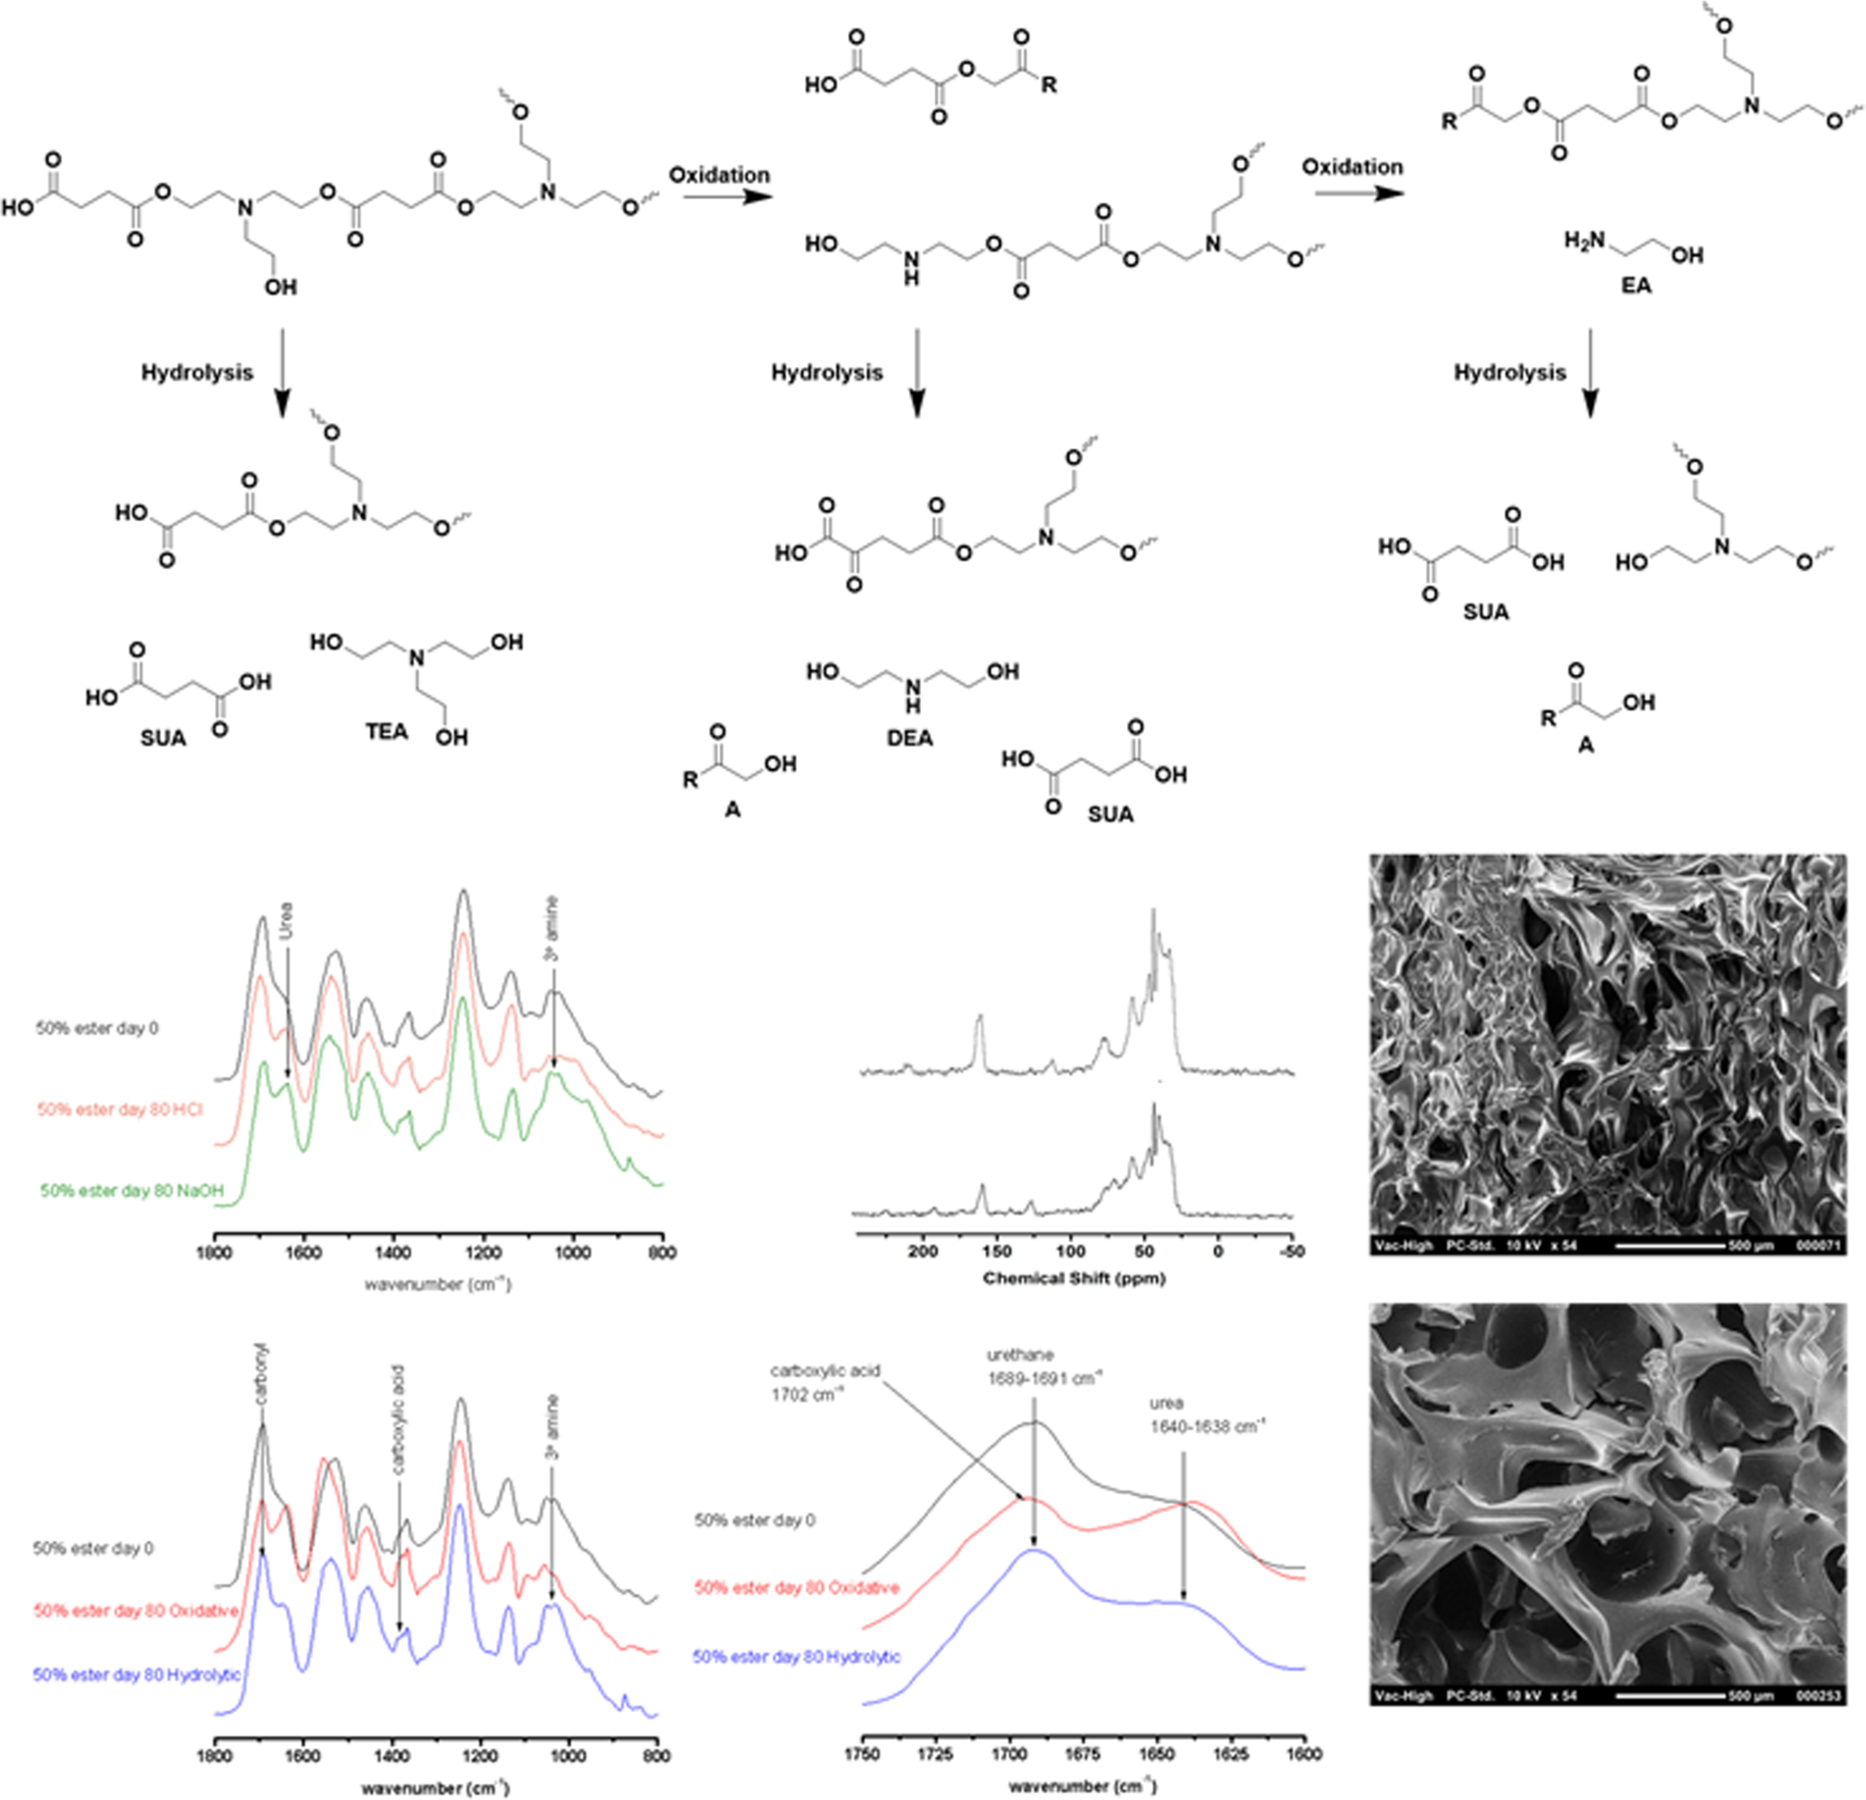
Figure 8.

(A) Major degradation hydrolytic and oxidative products. (B) FTIR spectra of 50% ester SMPs comparing acidic and basic degradation signals at 140 days. (C) 13NMR spectra of 50% ester SMP at 80 days oxidation and (D) hydrolysis. (E) 50% ester SMP at 140 days hydrolysis. (F) Comparison of degradation signals comparing basic hydrolysis and oxidation of 50% ester SMPs with virgin material and (G) the expanded spectra of the carbonyl region, displaying the peak shift associated with oxidative degradation. (H) SEM of 50% ester SMP oxidized for 50 days.
