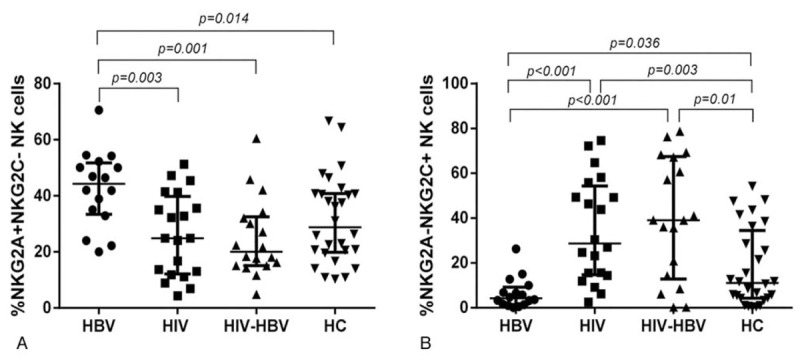
Figure 4.

Alterations of NKG2A and NKG2C co-expression on NK cells among the 4 groups. (A-B) The proportion of NKG2A-NKG2C+ and NKG2A+NKG2C- expression on the surface of NK cells among the 4 groups, respectively. Mann–Whitney tests were used to compare groups and P < .05 was considered statistically significant. Error bars indicate median and interquartile range. NK = natural killer.
