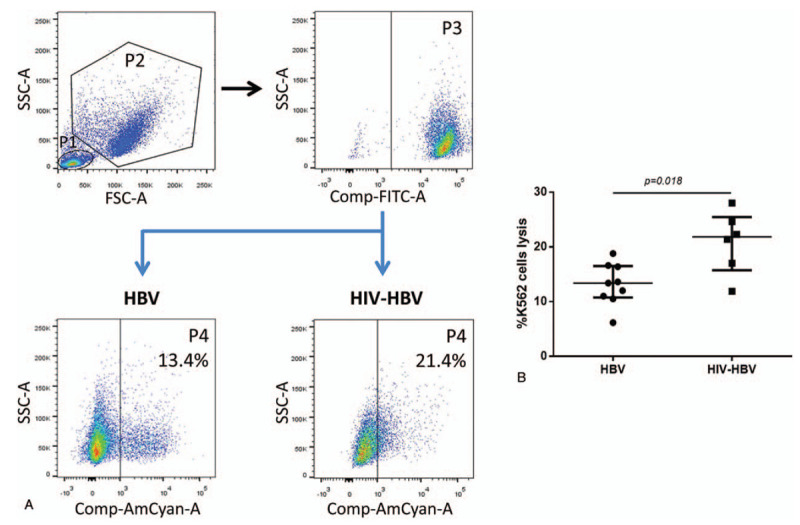
Figure 6.

Cytotoxicity of peripheral NK cells in HBV-infected and HIV/HBV-coinfected individuals. (A) The NK cells and K562 cells were gated according to forward and side scatter dot plot (P1 and P2). CFSE-labeled K562 cells (P3) were defined by side scatter dot plot and CFSE. K562 cells lysis (P4) was defined by side scatter dot plot and 7AAD. (B) The proportions of K562 lysis at the E:T ratio of 10:1 between 2 groups. Mann–Whitney tests were used to compare groups, and P < .05 was considered statistically significant. Error bars indicate median and interquartile range. NK = natural killer.
