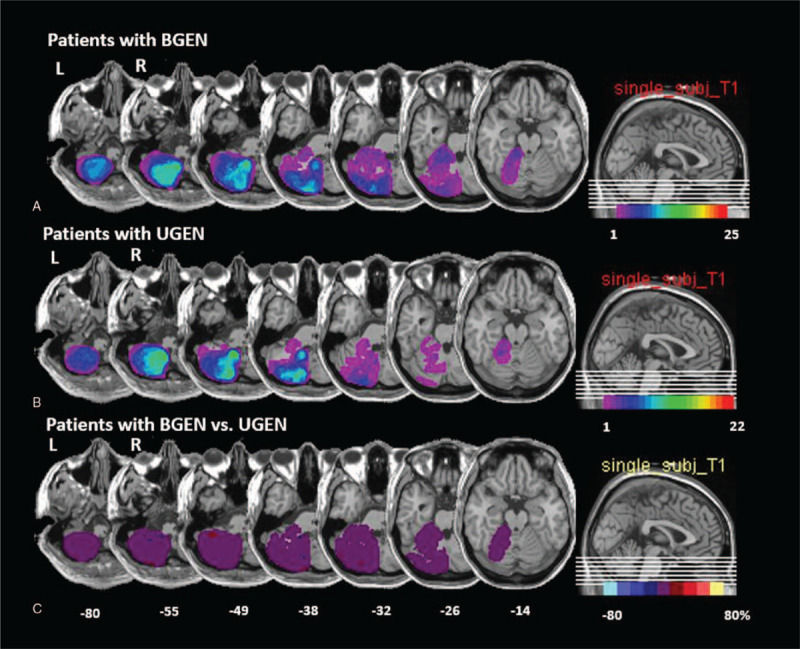
Figure 2.

Overlapping MRI lesions in patients BGEN (A) or UGEN (B). Left-sided lesions are flipped to the right side. The number of overlapping lesions is illustrated by different colors that code for increasing frequencies, which range from violet (n = 1) to red (n = 25 in the BGEN group and n = 22 in UGEN group). Overlay plot of the subtracted superimposed lesions of patients with BGEN minus the comparison (UGEN) group. (C) The percentage of overlapping lesions of the group with BGEN after subtraction of the comparison group is illustrated by 5 different colors, where dark red represents a difference of 1% to 20% and white–yellow represents a difference of 81% to 100%. Each color represents increments of 20%. The Talairach z-coordinates of each transverse slice are given. This figure illustrates that there are no differences between the 2 groups. BGEN = direction-changing bidirectional gaze-evoked nystagmus; UGEN = unidirectional gaze-evoked nystagmus.
