
Figure 4. Relapsed T-ALLs with pre-existing or acquired Nr3c1 mutations exhibit different evolutionary trajectories in response to dexamethasone treatment.
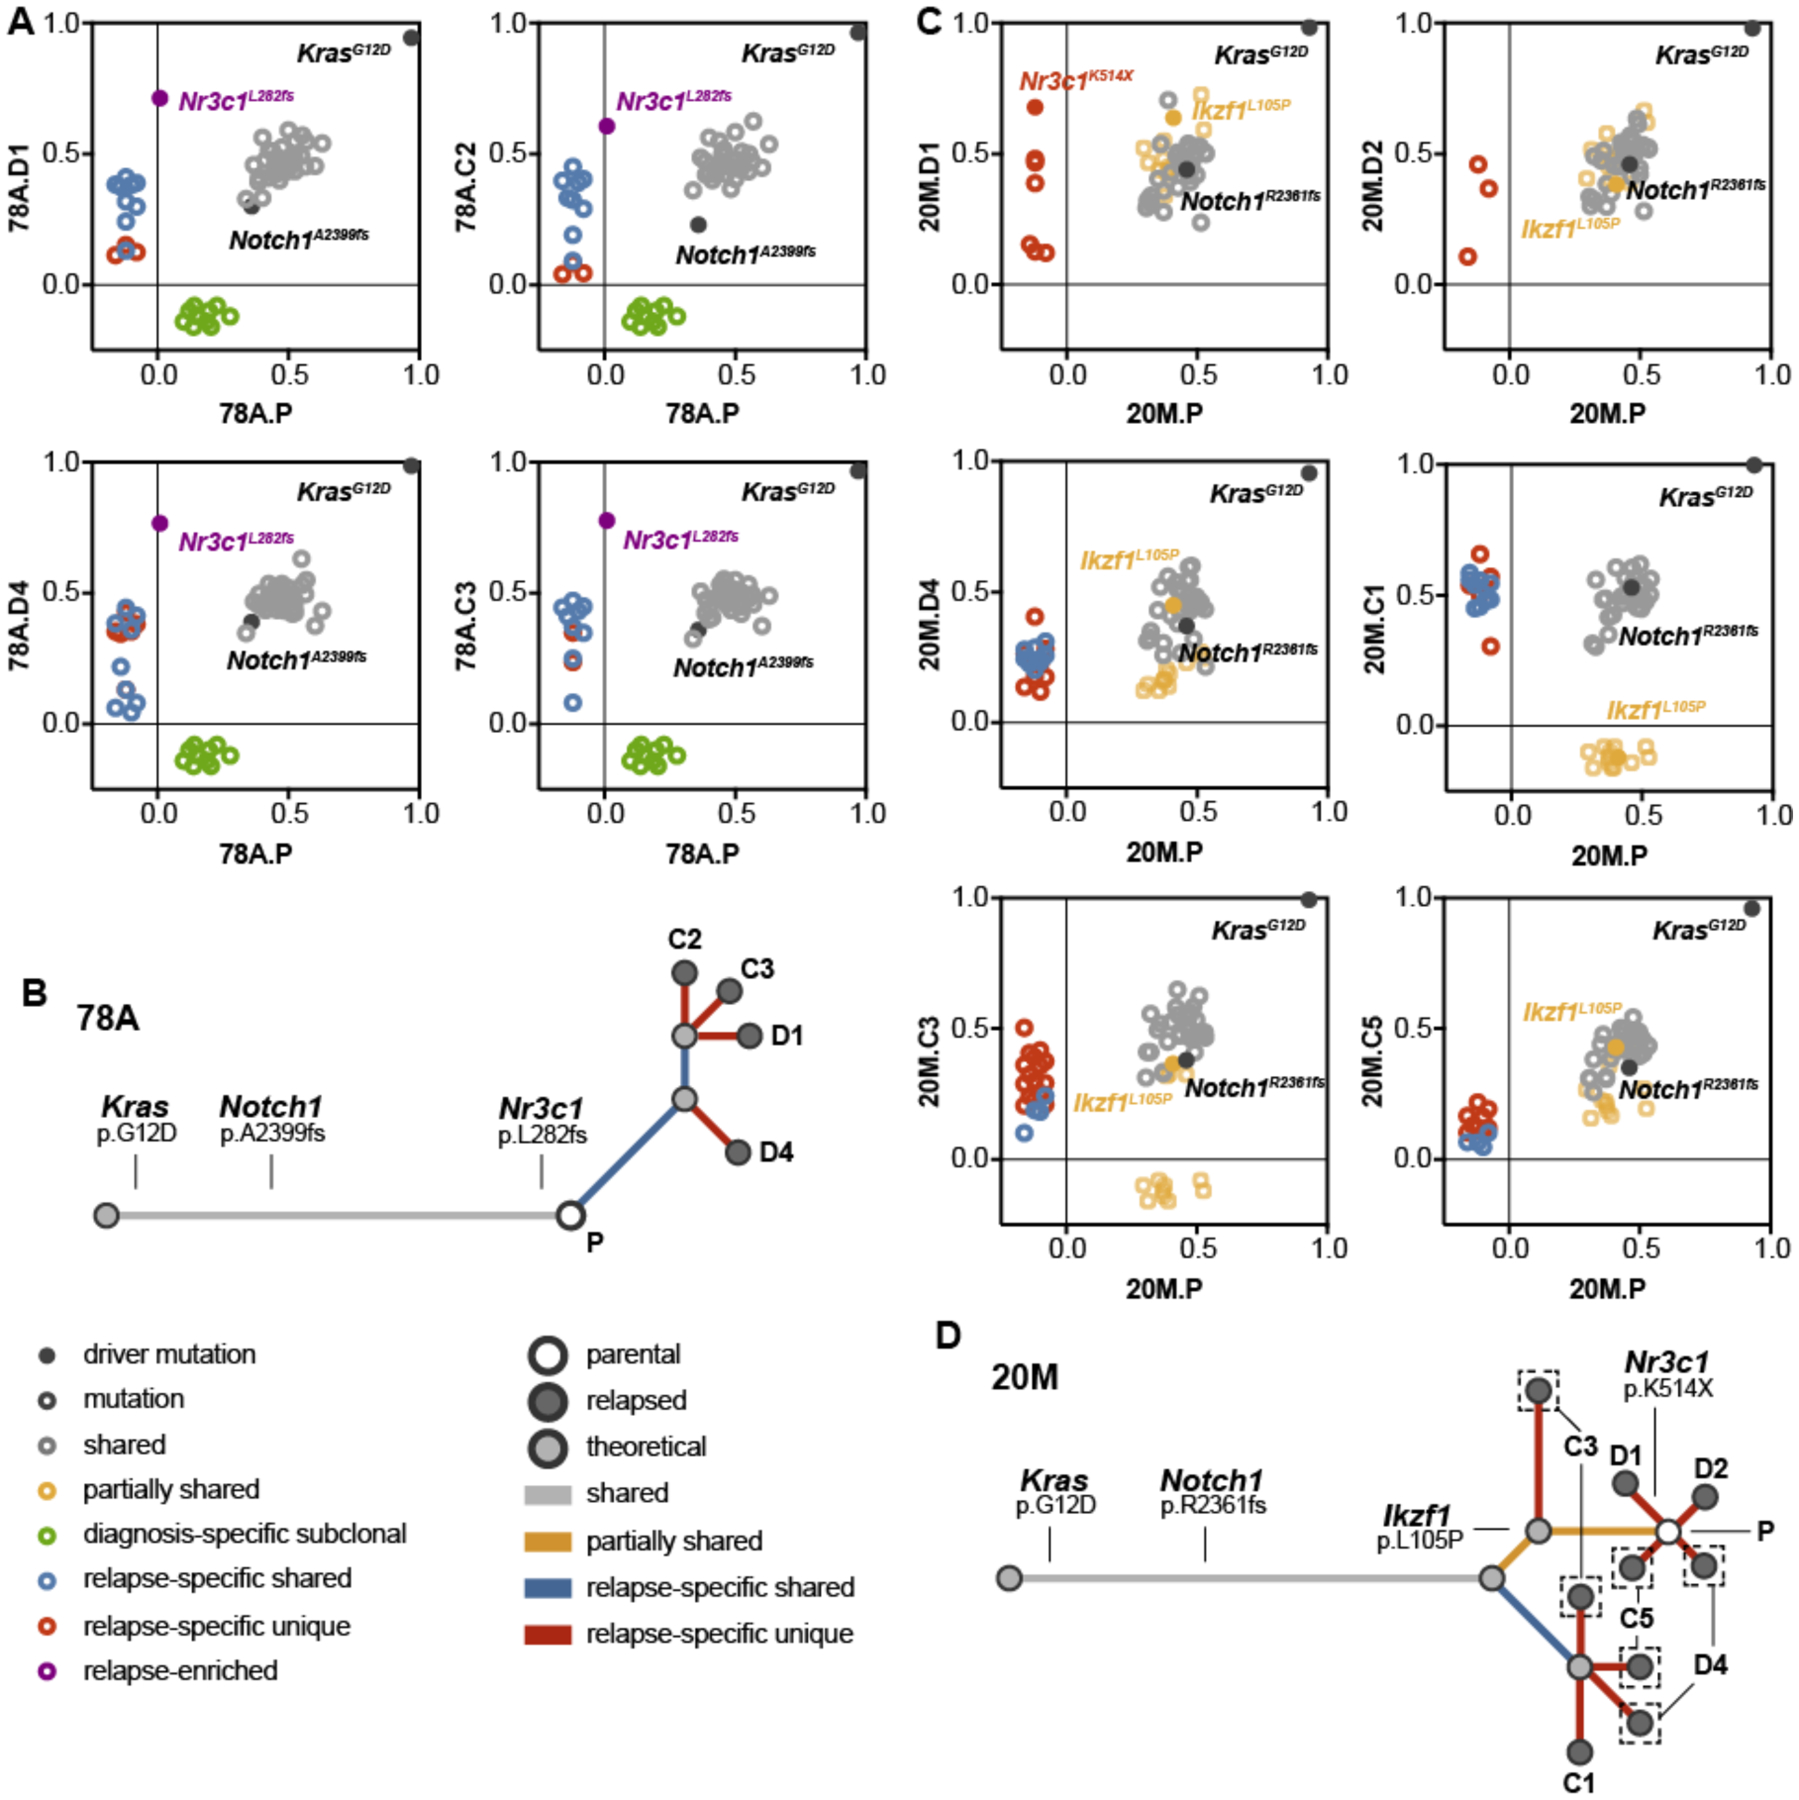
(A) Graphical representation of the mutant allele frequencies of missense mutations and indels shared between the parental T-ALL 78A (x-axis) and four independent relapsed leukemias (y-axis; grey), present only in the parental leukemia (green), shared only with other relapsed leukemias (blue), significantly enriched in the relapsed leukemia (purple), or specific to one of the relapsed leukemias (red). (B) Analysis of the evolutionary relationships among genetic alterations identified by WES in T-ALL 78A indicated a pattern of linear clonal evolution. (C) Graphical representation of the mutant allele frequencies shared between the parental T-ALL 20M (x-axis) and six independent relapsed leukemias (y-axis; grey), present in the parental and a subset of relapsed leukemias (yellow), shared only with other relapsed leukemias (blue), or specific to one of the relapsed leukemias (red). (D) Evolutionary analysis of the genetic alterations identified by WES in T-ALL 20M indicates a branching pattern of clonal dynamics involving multiple ancestral populations. Legends indicate the type of mutation represented by each dot shown in panels A and B (left), and each dot and branch in panels C and D. The same color scheme is used in the evolutionary analysis of panels A through D.