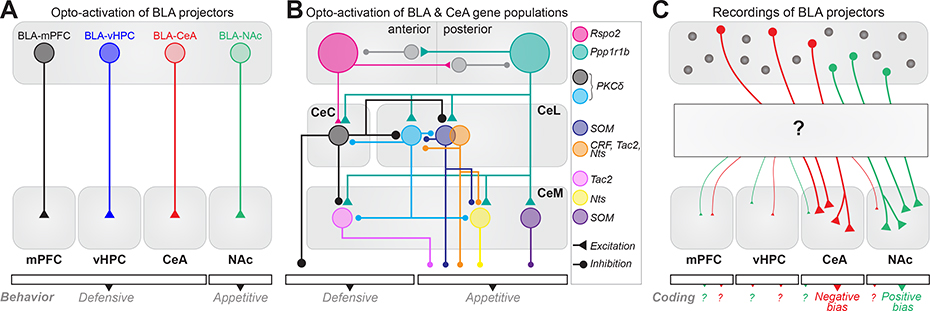
Figure 3.
Circuit diagram illustrating valence biases in BLA and CeA. (a) Optogenetic activation of three projection-defined BLA populations induces defensive behaviors [52,53,56] and activation of the last population induces appetitive behaviors [52,57,58] (b) Intra-amygdala circuit diagram of genetic populations in the anterior (a) and posterior (p) BLA, and CeA. Anterior BLA Rspo2+ and posterior BLA Ppp1r1b+ neurons drive opposite behavioral responses and reciprocally inhibit each other [62●●]. Rspo2+ neurons innervate CeC PKCδ+ neurons driving a defensive response. CeC PKCδ+ neurons inhibit CeL PKCδ+ neurons and Tac2+ CeM neurons, which mediate appetitive responses. Ppp1r1b+ neurons innervate all CeA neurons driving appetitive responses. CeC and CeL PKCδ+ neurons antagonize each other [29●●] (c) Recordings of BLA neurons defined by their projection have revealed coding biases for learned positive and negative valence. Although collateralization has been described at a population level, the relationship between collateralization pattern and valence coding at a single neuron level remains unknown.

