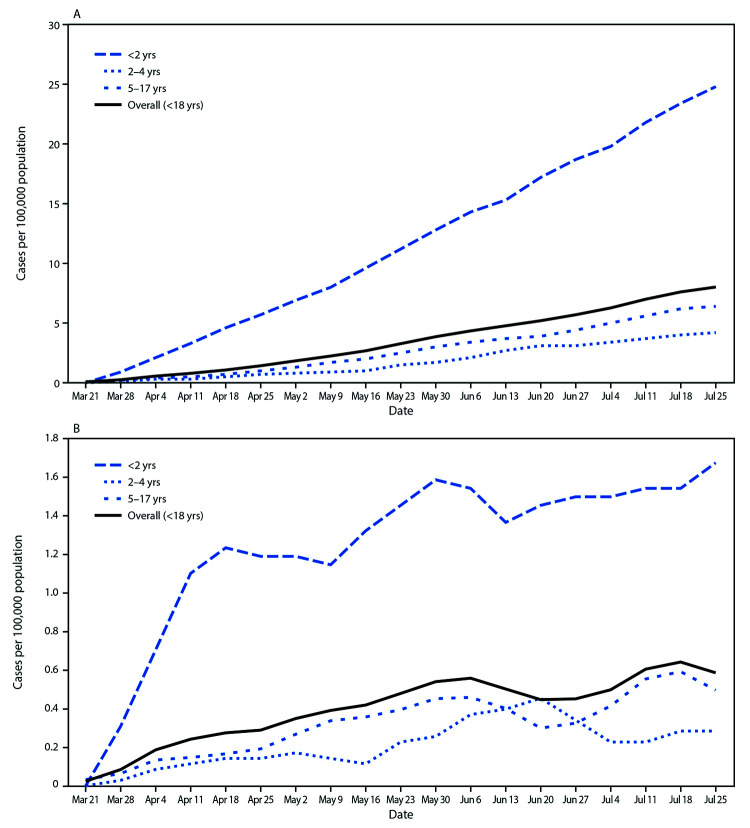
FIGURE 1.
Cumulative (A) and weekly (B) COVID-19–associated hospitalization rates*,† among children aged <18 years, by age group — COVID-NET, 14 states§, March 1–July 25, 2020¶
Abbreviation: COVID-NET = Coronavirus Disease 2019–Associated Hospitalization Surveillance Network.
* Number of children in each age group hospitalized with COVID-19 per 100,000 population.
† Figure B shows the 3-week moving average of weekly hospitalization rates for children in each age group hospitalized with COVID-19 per 100,000 population. A trend test was conducted using weighted linear regression, where the weight for each week was the inverse of the variance. Trend test overall (<18 years): p-value <0.001.
§ Counties included in COVID-NET surveillance: California (Alameda, Contra Costa, and San Francisco counties); Colorado (Adams, Arapahoe, Denver, Douglas, and Jefferson counties); Connecticut (New Haven and Middlesex counties); Georgia (Clayton, Cobb, DeKalb, Douglas, Fulton, Gwinnett, Newton, and Rockdale counties); Iowa (one county represented); Maryland (Allegany, Anne Arundel, Baltimore, Baltimore City, Calvert, Caroline, Carroll, Cecil, Charles, Dorchester, Frederick, Garrett, Harford, Howard, Kent, Montgomery, Prince George’s, Queen Anne’s, St. Mary’s, Somerset, Talbot, Washington, Wicomico, and Worcester counties); Michigan (Clinton, Eaton, Genesee, Ingham, and Washtenaw counties); Minnesota (Anoka, Carver, Dakota, Hennepin, Ramsey, Scott, and Washington counties); New Mexico (Bernalillo, Chaves, Dona Ana, Grant, Luna, San Juan, and Santa Fe counties); New York (Albany, Columbia, Genesee, Greene, Livingston, Monroe, Montgomery, Ontario, Orleans, Rensselaer, Saratoga, Schenectady, Schoharie, Wayne, and Yates counties); Ohio (Delaware, Fairfield, Franklin, Hocking, Licking, Madison, Morrow, Perry, Pickaway, and Union counties); Oregon (Clackamas, Multnomah, and Washington counties); Tennessee (Cheatham, Davidson, Dickson, Robertson, Rutherford, Sumner, Williamson, and Wilson counties); and Utah (Salt Lake County).
¶ Data are preliminary, and case counts and rates for recent hospital admissions are subject to lag. As data are received each week, previous case counts and rates are updated accordingly.

