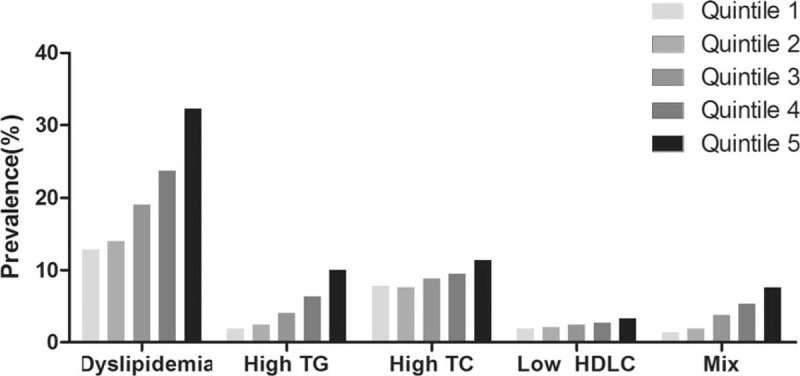
Figure 1.

Prevalence of dyslipidemia and its classification according to quintiles of serum uric acid levels. The participants were classified into quintiles according to their serum uric acid levels. For males: quintile 1 (Q1) < 278 μmol/L, 278 ≤ Q2 < 315 μmol/L, 315 ≤ Q3 < 347 μmol/L, 347 ≤ Q4 < 391 μmol/L, and Q5 ≥ 391 μmol/L; for females: Q1 < 200 μmol/L, 200 ≤ Q2 < 228 μmol/L, 228 ≤ Q3 < 256 μmol/L, 256 ≤ Q4 < 294 μmol/L, and Q5 ≥ 294 μmol/L. High TG = hypertriglyceridemia, High TC = hypercholesterolemia, Low HDLC = low high-density lipoprotein cholesterolemia, Mix = two or more combinations of hyperlipidemia. P-values for positive association between SUA levels and dyslipidemia and its classification are less than .001.
