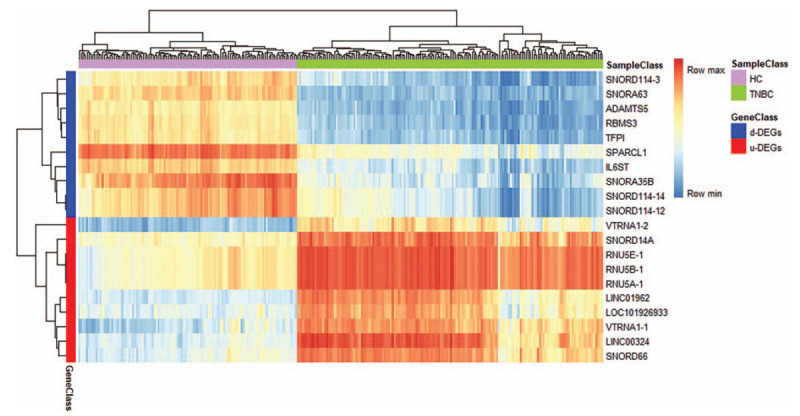
Figure 1.

Heatmap of top 10 up-regulated DEGs and top 10 down-regulated DEGs. Red, means up-regulation; Blue, means down-regulation. The value of expression intensity is derived from the gene expression level obtained by R software analysis. TNBC = Triple Negative Breast Cancer, HC = Health Control, d-DEGs = down-regulated DEGs, u-DEGs = up-regulated DEGs, DEGs = differentially expressed genes.
