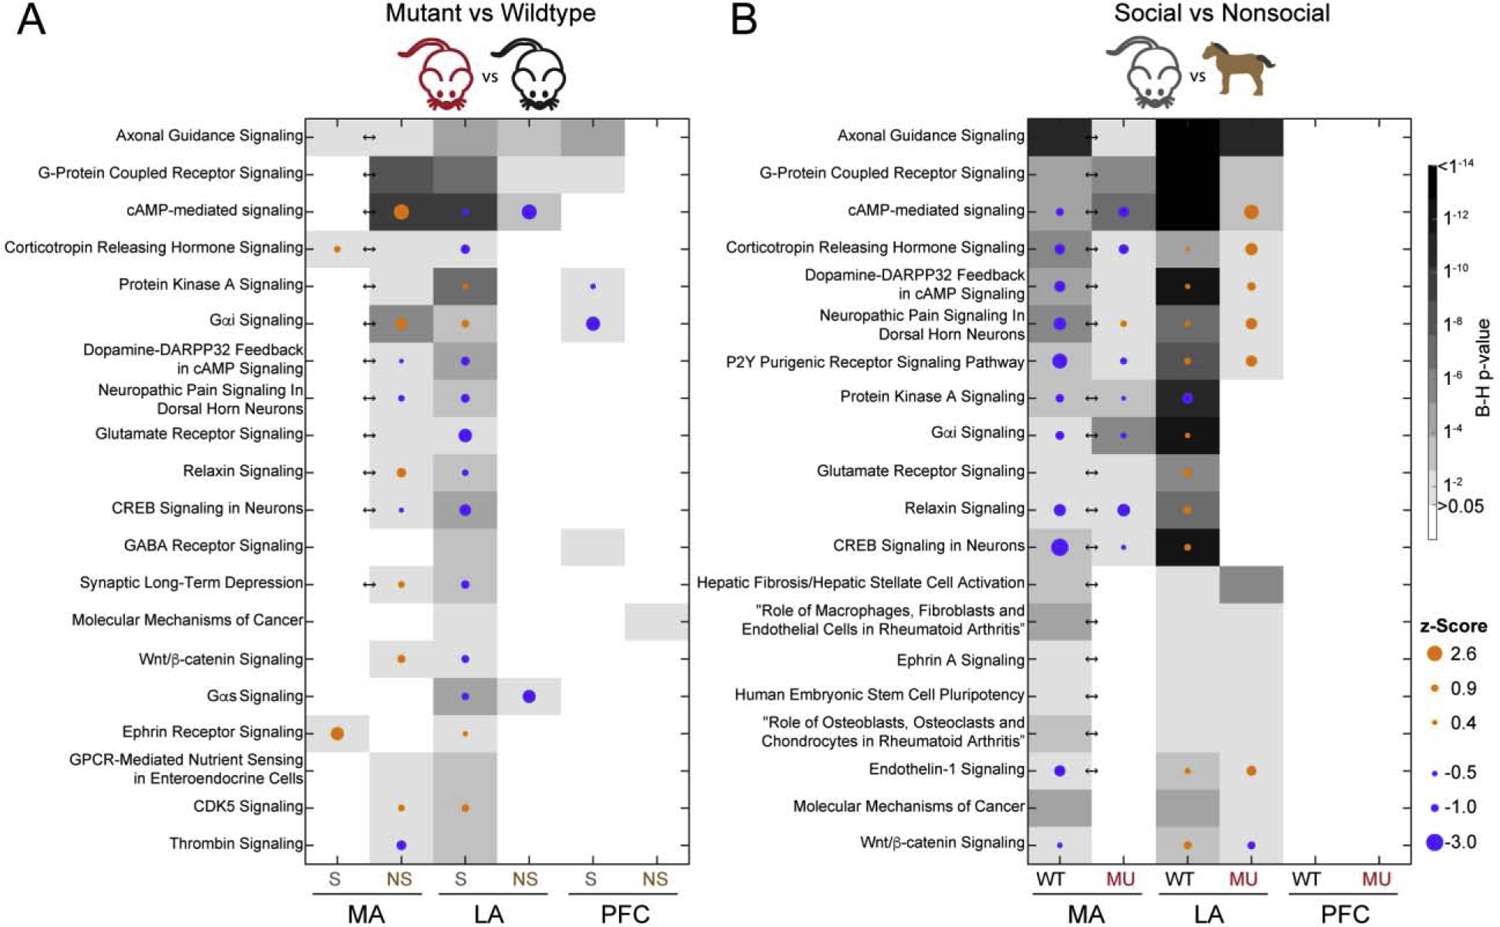
Figure 1.

The top 20 canonical pathways enriched for DEGs in A) mutant versus wildtype and B) social versus nonsocial comparisons. The intensity of the grayscale corresponds to the B-H p-value, indicated by the scalebar. Arrows indicate a significant interaction effect (B-H p < 0.05) for that brain region. The dots indicate a z-Score (B-H p-value) that predicts activation (orange) or inhibition (blue) of the pathway and the magnitude is indicated by the size.
