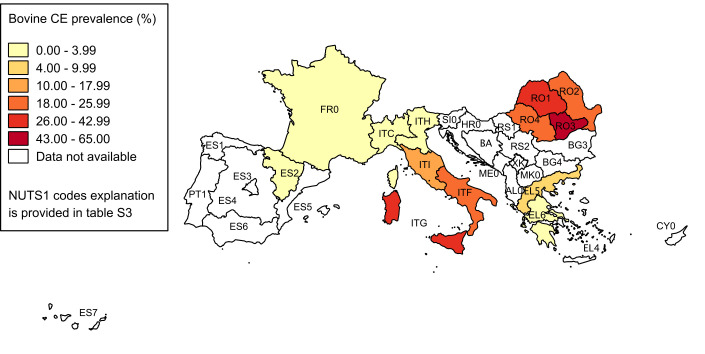
Fig 3. Spatial distribution of CE prevalence in cattle.
Pooled prevalence values at NUTS1 level are visualised with progressively intense colours according to ranges established by Jenks optimization method and manually adjusted for a better results visualisation. Data at country level are reported only if more detailed data at NUTS1 level were not available (source of NUTS shapefiles: Eurostat).

